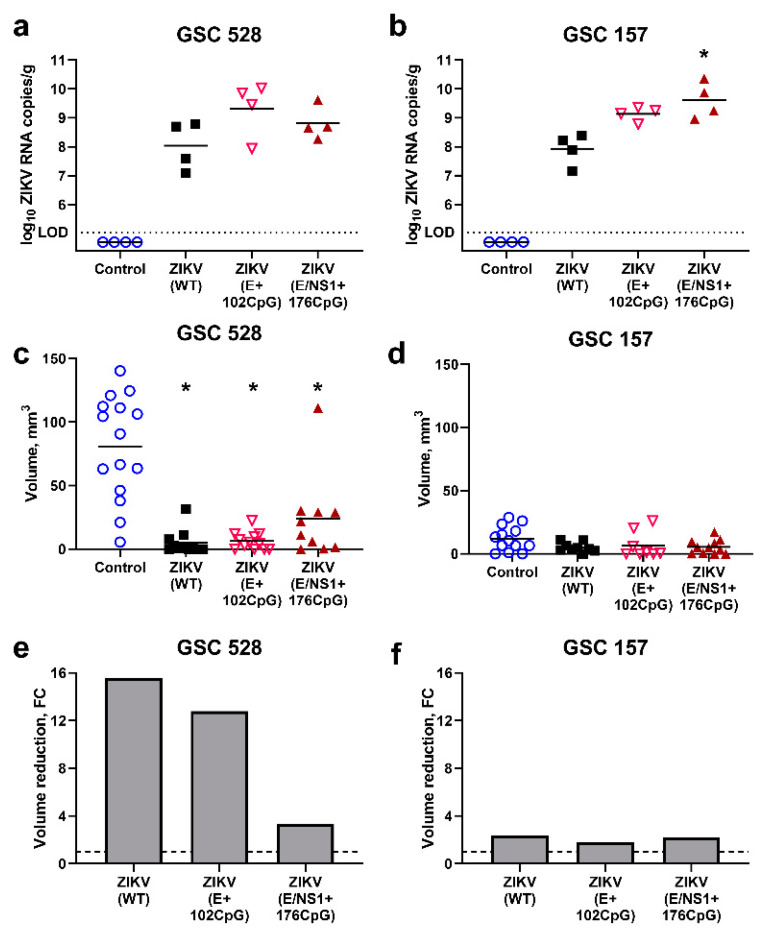
Figure 5.
Zika virus (ZIKV) quantification in tumors ((a) glioblastoma stem cells (GSC) 528; (b) GSC 157). The dotted line (a,b) represents limit of detection. The volume of tumors inoculated with ZIKV variants (c: GSC 528; d: GSC 157). Relative reduction of tumors ((e) GSC 528; (f) GSC 157); FC: fold change. *: p < 0.05; tumor volumes in ZIKV groups were compared to volumes in the control group. The dashed line (e,f) represents the base tumor volume in the control group. Sampling was performed at day 19 of embryonic development.

