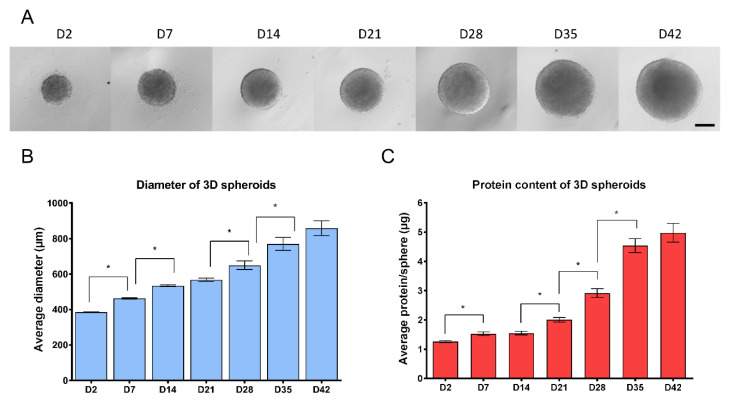
Figure 1.
Growth properties of 3D neurospheres during the 6 weeks of differentiation (A) Representative microscopic view of 3D spheroids, investigated at weekly intervals (4×, scale bar: 200 µm). (B) The average diameter of 3D spheroids in µm measured by CellSens Dimension software (Olympus) (n = 3, in each experiment 96 spheroids were compared weekly trough 6-weeks). (C) Average total protein content of spheroids determined by Pierce BCA Protein Assay. Note that D2, D7 and D14 samples were measured by pooling three spheroids and individual values were calculated, while in all other timepoints spheroids were measured individually (n = 3, in each stage 24 spheroids were measured). ±SEM values are presented on graphs. (* p < 0.05).

