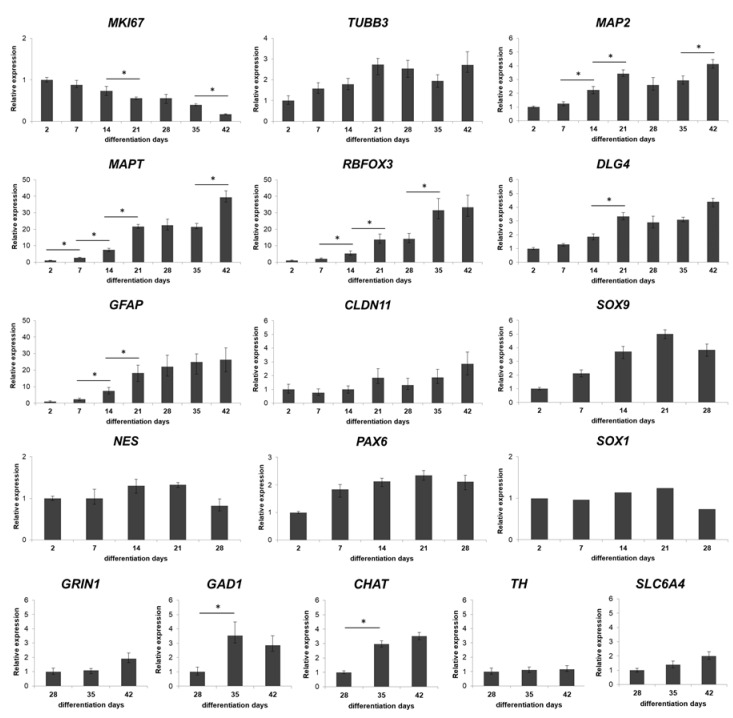
Figure 3.
Real-time PCR measurements of relevant markers during the neuronal differentiation of the spheroids. Twelve 3D spheroids were pooled, lysed with RLT-buffer and used in RT-PCR analysis at each timepoints. Where the genes are already expressed in D2 samples, it is referred as 1. Day 2, 7, 14 and 21 values for GRIN1, CHAT, TH, GAD1, and SLC6A4 are not indicated as these genes were not expressed at those time points. Graphs represent normalized relative expression values, analyzed for each gene using the ddCT method [41]. Mean values and ± SEM of three biological replicates (n = 3) are presented on graphs, significance are determined by paired T test (∗ p < 0.01). Note that y axis’s scales alter according to the different relative expression values.

