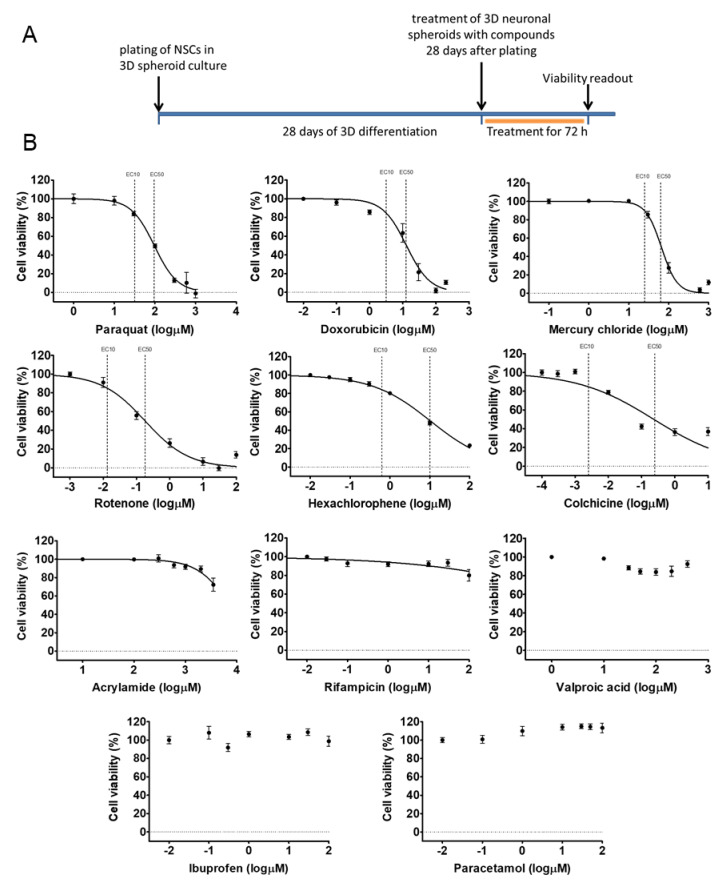
Figure 6.
Cell viability measurement on D28 3D neurospheres after 72 h exposure with toxicants. (A) exposure scheme at D28 stage. (B) Concentration-response curves of compounds, tested in 7 different concentrations (see concentrations listed in Table S3), representing the cell viability (%) of treated D28 3D neurospheres (n = 3). Concentration values are presented in log µM ± SEM. EC10 and EC50 values are presented on graphs where applicable.

