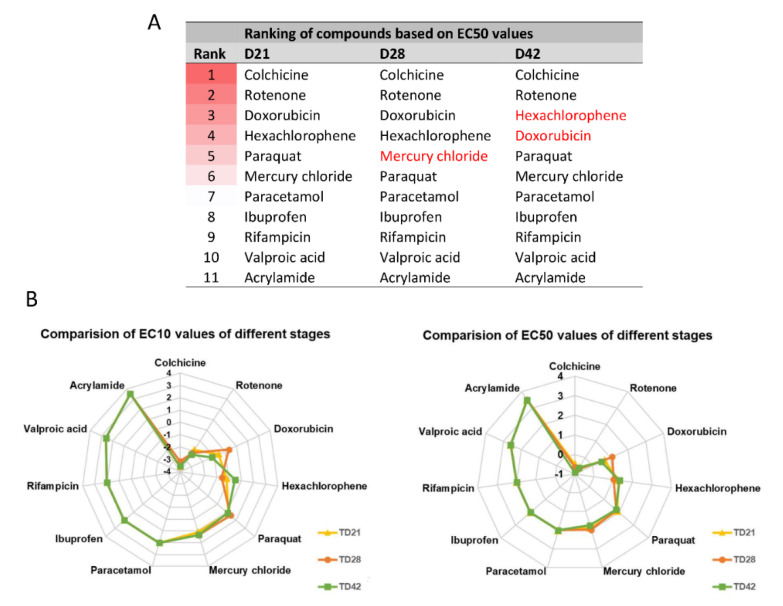
Figure 8.
Comparison of the toxic effect of compounds. (A) Ranking of compounds at different differentiation stages based on EC50 values. Darker background color represents higher toxicity, while white color represents non-toxic compounds. (B) Radar chart showing the comparison of compounds based on the order of EC10 or EC50 values, at various differentiation stages (yellow line with rectangular: D21; orange line with circle: D28; green line with square: D42) (see also EC values in Table S4). Concentration values are presented in log µM.

