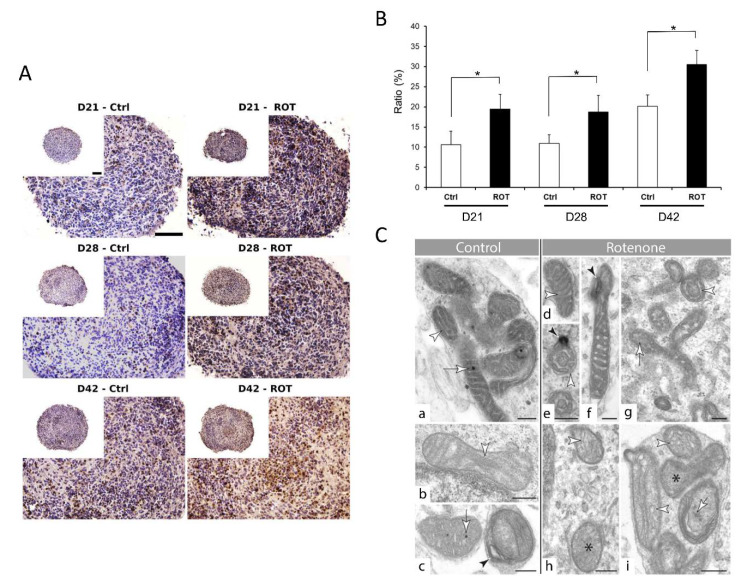
Figure 9.
Effect of Rotenone (ROT) exposure on 3D neurospheres at three differentiation stages. (A) 3D neurospheres were treated with 0.5 µM ROT concentration for 72 h at three different maturation timepoints (D21, D28, and D42), fixed, sectioned and analyzed to detect the cellular effect of ROT by TUNEL assay (DeadEnd™ Colorimetric TUNEL System, Promega), compared to the vehicle (0.1% DMSO) treated control (scale bar: 100 µm). (B) ROT treatment revealed in average a 15% increase in the apoptotic cell number compared to the control in each stage (* p < 0.05). Average values are presented on graphs (n = 3). (C) Ultrastructure of mitochondria in control (panel a, b, c) and ROT treated (d–i) neurons in the 3D spheroids. See the alteration of the internal membrane (cristae) morphology (white arrowheads) in ROT treated cells (d, e, h, i). Black star: unidentifiable cristae morphology in lighter mitochondria (h, i); black arrowhead: membrane swirl in darker organelles (e, f); white arrows: matrix with and without matrix granules (control cells: a, c; treated cells: g, i) Note the density difference between these granules in control (c) and ROT treated mitochondria (panel i) (D21: a, d, f, h; D28: i; D42: b, c, g) (scale bar: 250 nm).

