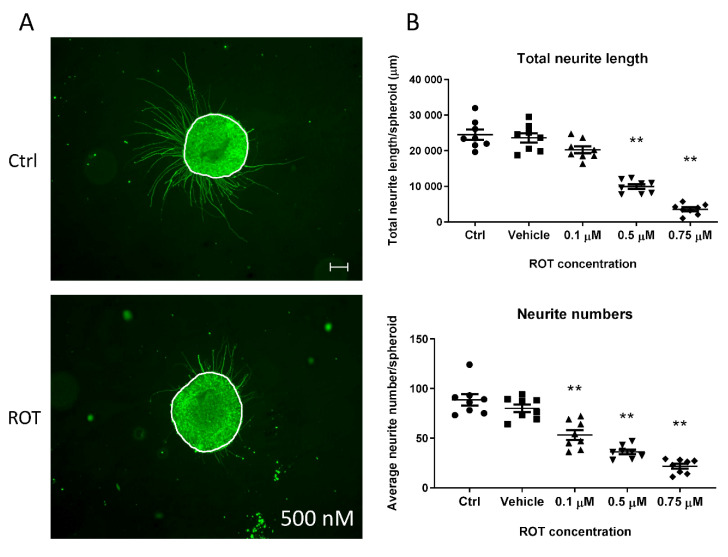
Figure 10.
Neurite outgrowth measurement on D21 3D spheroids, exposed for 72 h with ROT. (A) Representative photograph of control (untreated) and ROT (0.5 µM) treated D21 spheroid immunolabeled with TUBB3 (in green). White lines represent the border of the spheroids where the neurite outgrowth was determined from, using ImageJ software (scale bar: 100 µm). (B) Total neurite length/spheroid (presented in µm ± SEM) and the average number of neurites/spheroids were determined 24 h after plating the treated spheroids. Different symbols denote treatment groups. (n = 3, in each experiment 8 spheroids were treated in each group) (** p < 0.01).

