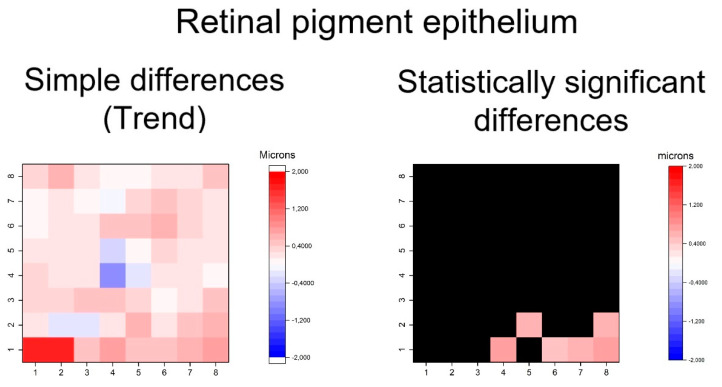
Figure 10.
Heatmaps showing differences in the retinal pigment epithelium layer. Left map: this heatmap represents simple differences of mean thickness between OHT group and early POAG group in each superpixel giving an idea of the trend. Right map: the heatmap represents statistically significant differences (p < 0.05) of the mean thickness between groups in each superpixel. No significant difference (p ≥ 0.05) is represented in black. Range of significant OHT-POAG differences in superpixels between 0.51 and 0.75 microns.

