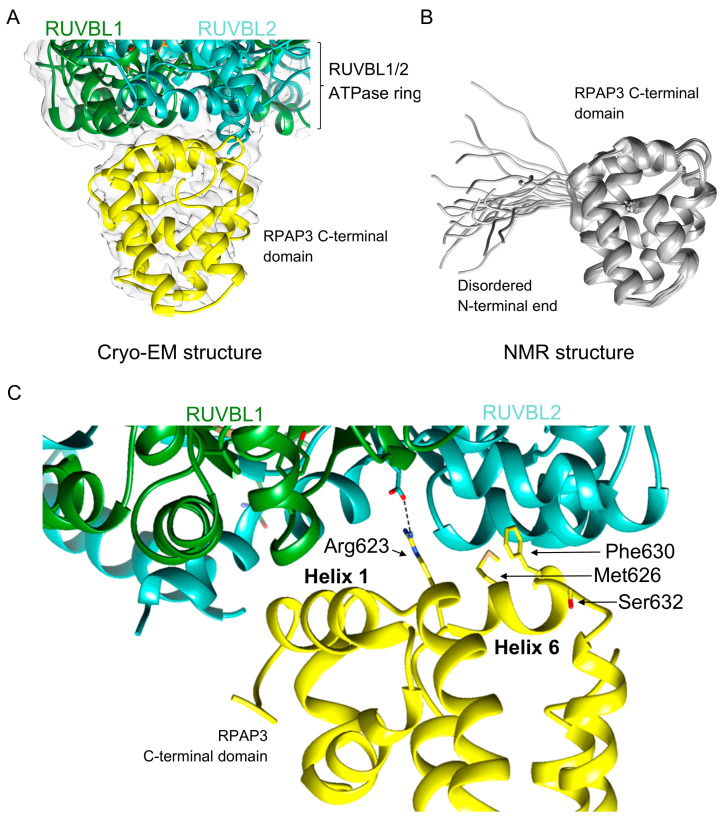
Figure 4.
Structure of the RPAP3 C-terminal domain. (A) One view of the structure of the RPAP3 C-terminal domain obtained using cryo-EM [37]. The structure shows the interaction with the RUVBL1-RUVBL2 complex. The experimental cryo-EM map is represented as a transparent density. (B) NMR coordinates of the RPAP3 C-terminal domain [27]. (C) Close-up of the region of contact between the RPAP3 C-terminal domain and RUVBL2 observed by cryo-EM [37], indicating the residues mutated by Maurizy and colleagues [27].

