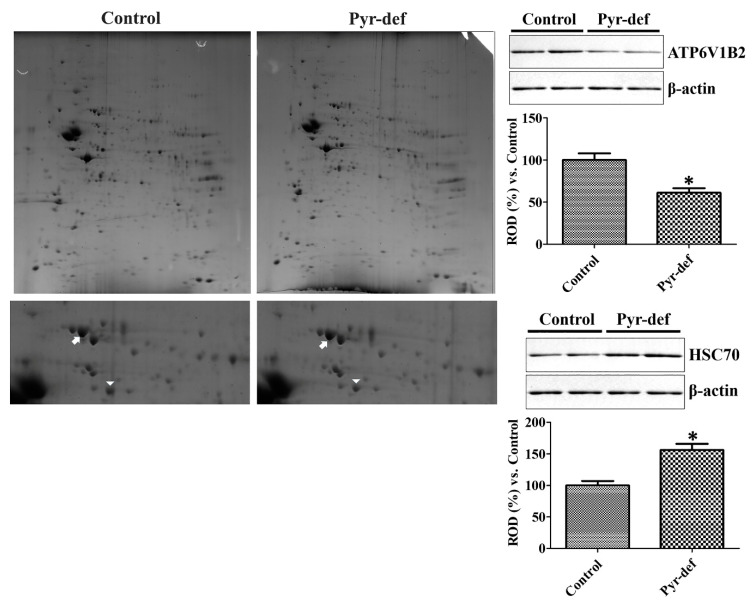
Figure 3.
Two-dimensional gel electrophoresis (2DE) and subsequent matrix-assisted laser desorption/ionization time-of-flight mass spectrometry (MALDI-TOF MS) analysis of the hippocampus of control and pyridoxine deficient diet-fed mice. (Left) 2DE gels are enlarged and each panel shows an enlarged view of 2DE gel spots that were expressed differentially (arrowheads and arrows are ATP6V1B2 and HSC70, respectively). (Right) Western blot analysis of differentially expressed proteins (ATP6V1B2 and HSC70) in the hippocampus of control and Pyr-def mice (n = 6 per group; * p < 0.05, vs. vehicle-treated group). All data are shown as the ratio to control group ± SEM.

