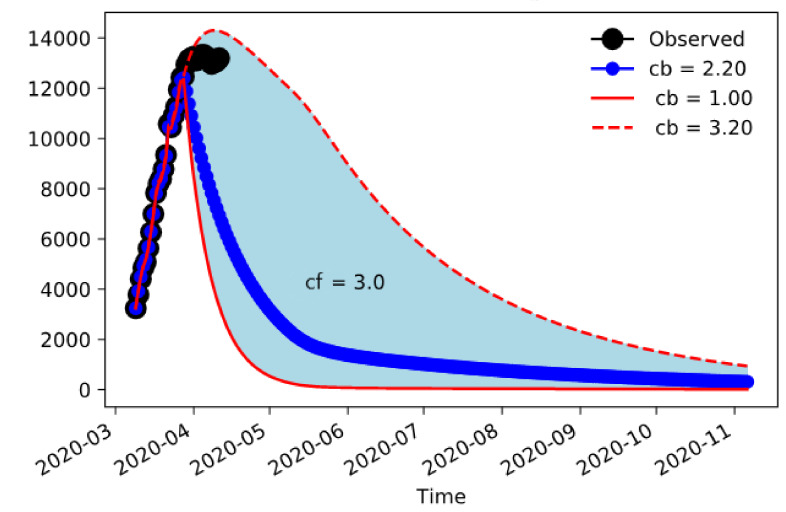
Figure 2.
Number of COVID-19-associated hospitalizations in Lombardy according to the extended SEIR model. The black dots are observations, the red lines are the extrema of the ensemble, and the blue line is the center value. The envelope of the ensemble was calculated varying the minimum number of contacts reached by the containment measures from 1.0 to 3.2 in steps of 0.2. Nudging was performed until 15 days before 12 April.

