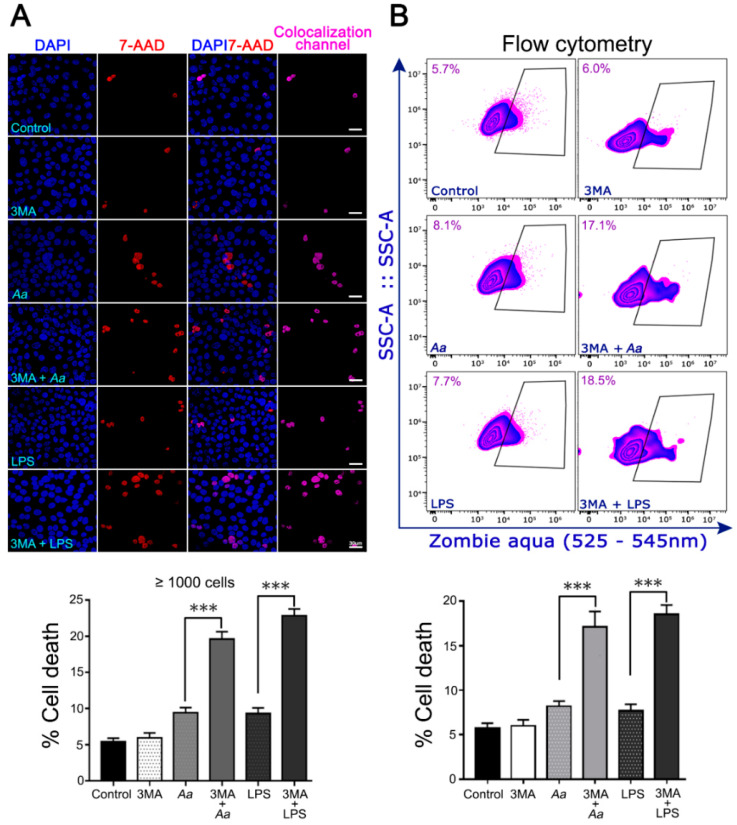
Figure 8.
Impact of autophagy pharmacological inhibition on host-cell viability after A. actinomycetemcomitans (A.a) challenge. OKF6/TERT-2 cells were incubated with A.a or its purified LPS in the presence or not of 3-MA, an upstream autophagy inhibitor. (A) Fluorescence staining visualized by confocal microscopy. After bacterial infection or LPS-stimulation OKF6/TERT-2 cells were washed and incubated with the fluorescent nucleic acid dye 7-aminoactinomycin (7-AAD). Cells were fixed and stained with the fluorescent dye DAPI and analyzed by confocal microscopy. Blue: DNA-rich structures stained with DAPI (total cell population). Red: DNA-rich structures stained with 7-AAD (dead cells). DAPI/7-AAD: overlap of images obtained from DAPI and 7-AAD channels. Colocalization channel: cells labeled by both fluorophores. The bar graph represents the percentage of dead cells (7-AAD positive) recorded in 1000 cells of three independent experiments. (B) A.a-infected or LPS-stimulated OKF6-TERT-2 cells were washed and incubated with the amine-reactive fluorescent dye Zombie Aqua and analyzed by flow cytometry. Dot-plots represent the total acquired events showing the live and dead (inside the black box) cell populations. The bar graph below represents the percentage of cell death obtained by flow cytometry of five independent assays. *** p < 0.001.

