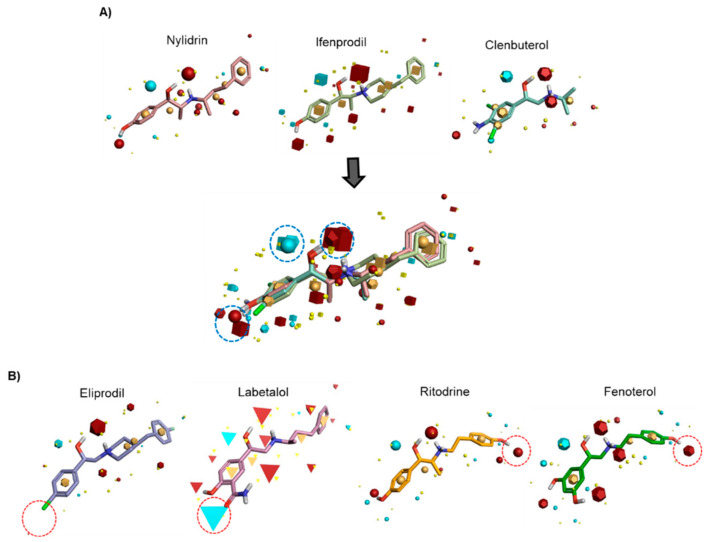
Figure 1.
Identification of common pharmacophore active regions on the basis of field points from the ligand-based pharmacophore model. (A) Field-based template model of three active molecules, nylidrin, ifenprodil, and clenbuterol, and their merged image. Highly conserved electrostatic domains are highlighted in dotted blue circles. (B) Representation of four template compounds with little or no activity. Unfavorable electrostatic domains, distinct from the active compounds, are marked in dotted red circles. Field points are visualized as follows: blue, negative electrostatic potential; red, positive electrostatic potential; orange, hydrophobic; and yellow, van der Waals.

