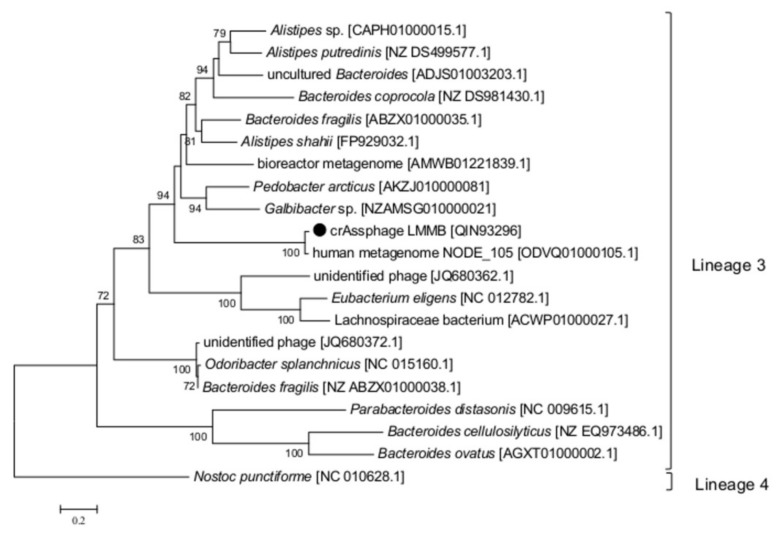
Figure 4.
Phylogenetic analysis of the reverse transcriptase (RT) of the crAssphage LMMB and a number of similar RTs. The investigated sequence is marked with a black circle. The IDs of the genomes, which were used to extract gene sequences encoding RTs and translate them into aa sequences, are indicated in square brackets. Nucleotide sequences were extracted from the Supplementary data [9]. Phylogenetic analysis was performed using the maximum-likelihood method. The RT of Nostoc punctiforme (the Cyanobacteria phylum) was used as an out-group. Bootstrap values >70% are given at nodes.

