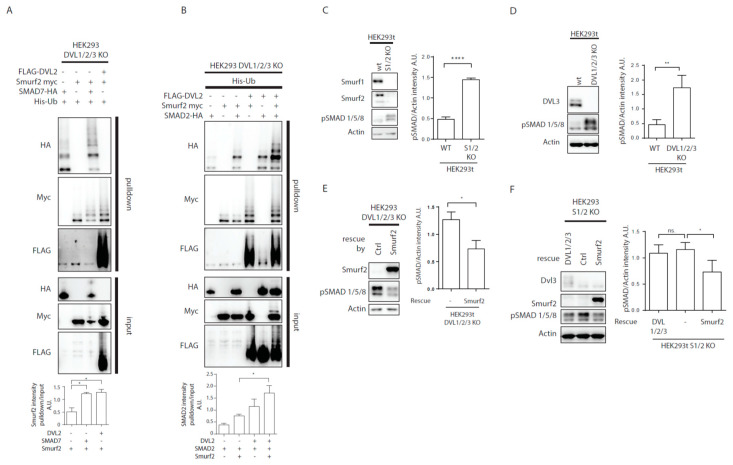
Figure 4.
DVL regulates TGF-β/BMP pathways activity. (A,B) DVL KO HEK293t cells were transfected by the indicated plasmids and subjected to ubiquitination assay. (A) Both SMAD7 and DVL2 are activators of Smurf2. Graph shows quantification of ratio of pulldown to input intensity of Smurf2 protein in stated conditions, * p < 0.05, n = 3. (B) SMAD2 ubiquitination by Smurf2 is enhanced by DVL co-expression. Graph shows quantification of ratio of pulldown to input intensity of SMAD2 protein in stated conditions, * p < 0.05, n = 3. (C) Wt HEK293t and Smurf1 Smurf2 KO HEK29t3 (S1/2 KO) were seeded to equal density and collected after 48 h. Knock-out of Smurf1 and Smurf2 in HEK293 cells leads to overactivation of BMP pathway as measured by levels of pSMAD 1/5/8. Graph represents quantification of WB results, pSMAD1/5/8, and Actin intensities were normalized to average, n = 3, SEM, **** p < 0.0001. (D) Wt and DVL1/2/3 KO HEK293t cells were seeded to equal density and collected after 48 h. Knock-out of DVL1, DVL2, and DVL3 in HEK293 cells leads to overactivation of BMP pathway as measured by pSMAD 1/5/8 levels. Graph represents quantification of WB results, pSMAD1/5/8 and Actin intensities were normalized to average, n = 3, SEM, ** p < 0.01. (E) DVL1/2/3 KO HEK293t were transfected by pcDNA (-) as ctrl or Smurf2 expressing plasmid, and samples were collected after 48 h. Smurf2 inhibits BMP pathway activity in DVL1/2/3 KO HEK293. Graph represents quantification of WB results, pSMAD1/5/8, and Actin intensities were normalized to average, n = 3, SEM, * p < 0.05. (F) S1/2 KO HEK293t cells were seeded and were transfected by pcDNA (-) as ctrl, DVL1-FLAG, DVL2-FLAG, and DVL3-FLAG (DVL1/2/3) or Smurf2-Myc expressing plasmids. Smurf2 inhibits whereas DVL expression is unable to inhibit BMP pathway activity in S1/2 KO HEK293t cells. Graph represents quantification of WB results, pSMAD1/5/8, and Actin intensities were normalized to average, n = 3, SEM, * p < 0.05. Plasmids, antibodies and gRNAs used for CRISPR used are listed in Table 1, Table 2 and Table 3.

