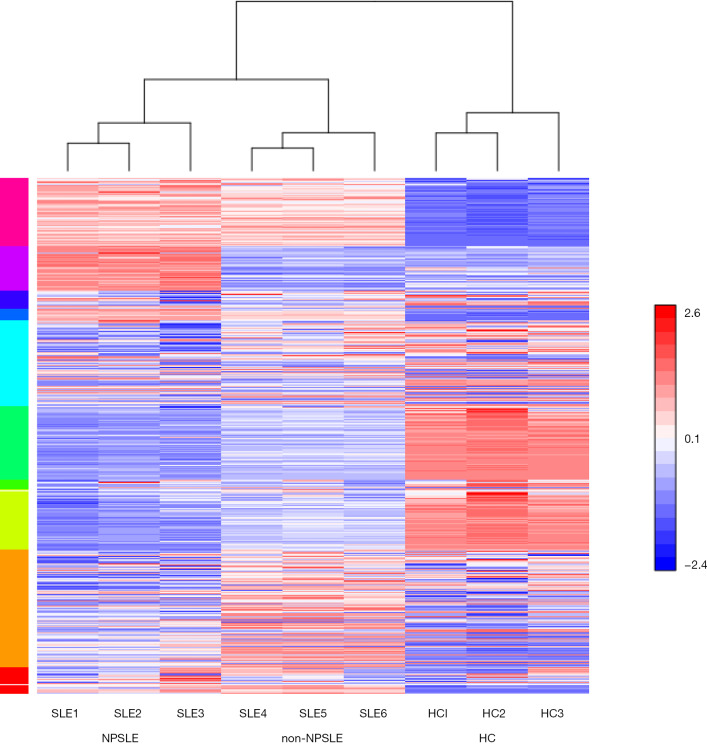
Figure 1.
Heat map showing hierarchical clustering of proteins with expression changes greater than two-fold and P value <0.01. NPSLE: SLE1–3; non-NPSLE: SLE3–6; Healthy control group: HC1–3. Red and blue colors represent up- and downregulated proteins, respectively. NPSLE, neuropsychiatric systemic lupus erythematosus; SLE, systemic lupus erythematosus; HC, healthy control.

