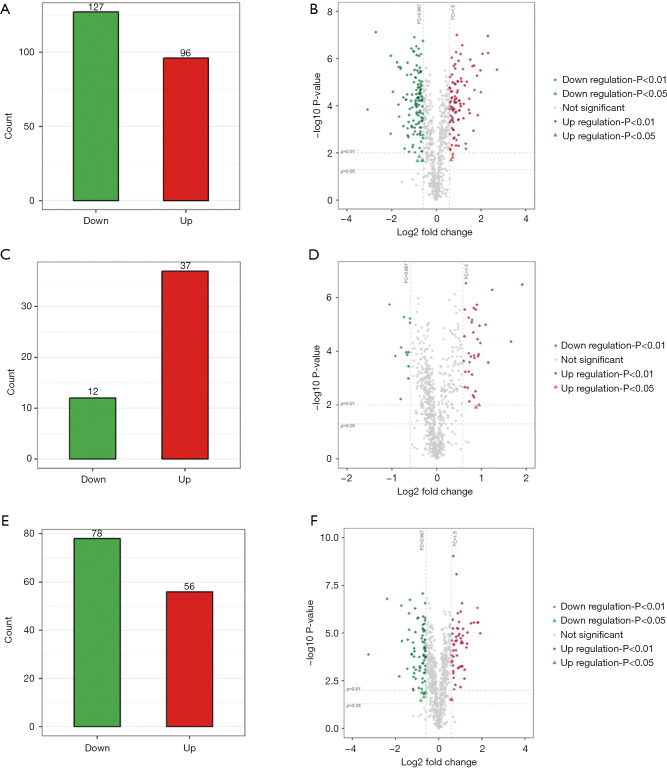
Figure 2.
The differentially expressed proteins in NPSLE, non-NPSLE patients and HCs. (A,C,E) Histogram showed the differentially expressed proteins between NPSLE/HC, NPSLE/non-NPSLE and non-NPSLE/HC samples; (B,D,F) volcano plot of differentially expressed proteins. The horizontal dotted lines represent a P value of 0.01 and 0.05, and vertical dotted lines represent 2.0-fold changes up and down. X axes are the fold change values (log2 scaled), and Y axes are the P values (log10 scaled). Red and blue plots represent up- and downregulated genes, respectively. NPSLE, neuropsychiatric systemic lupus erythematosus; HC, healthy control.

