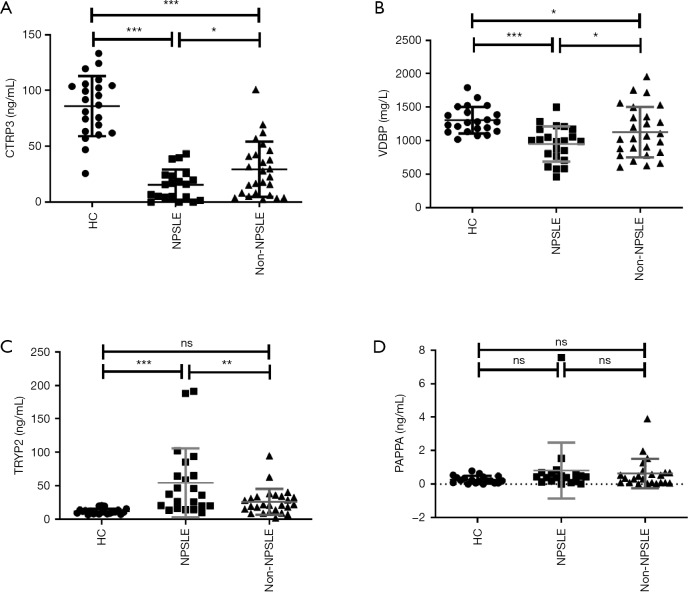
Figure 4.
The differentially expressed proteins levels in plasma in of NPSLE patients, non-NPSLE patients and HCs are identified using ELISA. (A) The CTRP3 levels were significantly decreased in NPSLE patients and non-NPSLE patients. n (NPSLE) =20, n (non-NPSLE) =26, n (HC) =22; (B) the VDBP levels were significantly decreased in NPSLE patients and non-NPSLE patients. n (NPSLE) =22, n (non-NPSLE) =26, n (HC) =22; (C) the TRYP2 levels were significantly decreased in NPSLE patients instead of non-NPSLE patients. n (NPSLE) =22, n (non-NPSLE) =26, n (HC) =22; (D) there was a trend that PAPPA levels were increased in NPSLE patients. n (NPSLE) =19, n (non-NPSLE) =23, n (HC) =19. *, P<0.05; **, P<0.01; ***, P<0.001. ns, P>0.05.

