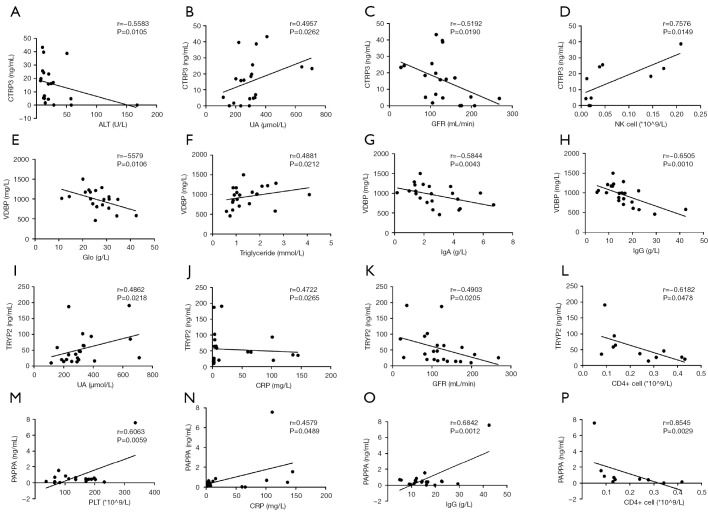
Figure 5.
Correlation between differentially expressed proteins and clinical characteristics in NPSLE patients. (A,B,C,D) The expression levels of CTRP3 were associated with aminotransferase (ALT), uric acid (UA), glomerular filtration rate (GFR) and NK cells numbers; (E,F,G,H) the expression levels of VDBP were associated with globin (Glo), triglyceride, serum IgA and IgG levels; (I,J,K,L) the expression levels of TRYP2 were associated with UA, CRP, GFR and CD4+ cells numbers; (M,N,O,P) the expression levels of PAPPA were associated with platelets (PLT), CRP, serum IgG levels and CD4+ cells numbers.

