Figure 3.
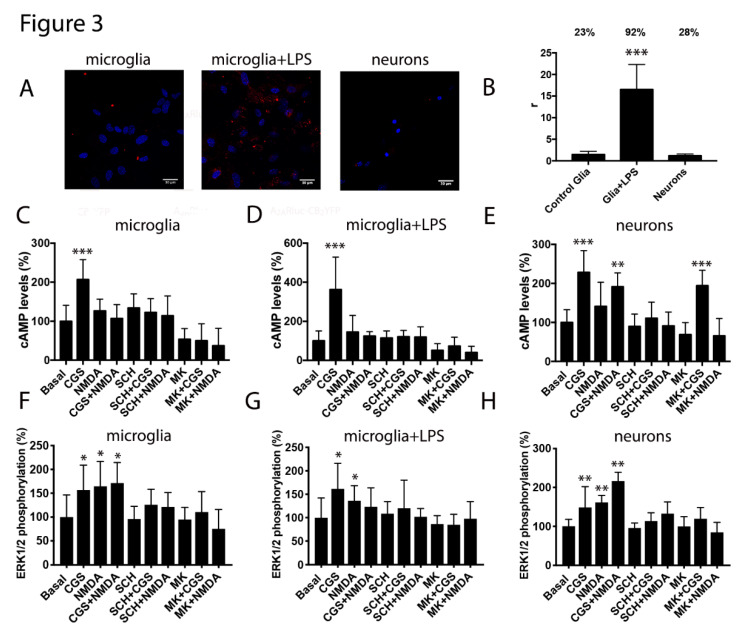
Expression and functionality of the A2A and NMDA receptors heteromers in the microglial and neuronal primary cultures. Panels (A,B). The proximity ligation assay (PLA) was performed in mice microglial primary cultures treated or not with 1 µM lipopolysaccharide (LPS) and 200 U/mL interferon-γ (IFN-γ) to activate the microglia and in the mice hippocampal primary cultures of neurons using the primary antibodies specific for the A2A and NMDA receptors. In all cases, the cell nuclei were stained with Hoechst (blue). The confocal microscopy images are shown (superimposed sections) in which heteromers appear as red clusters (in neurons or microglia). Scale bars = 30 μm. The bar graph (B) shows the number of the red dots/cell (r) and the numbers above the bars indicate the percentage of cells presenting red dots. Values are the mean ± SEM (n = 8). A one-way ANOVA followed by Bonferroni’s multiple comparison post-hoc test were used for statistical analysis (*** p < 0.001, versus control -resting- microglia). Panels (C–H) display the microglial primary cultures treated (D,G) or not (C,F) with 1 µM LPS and 200 U/mL IFN-γ and the mice hippocampal primary cultures of the neurons (E,H) that were pre-incubated or not with 1 μM of the A2AR antagonist SCH-58261 (SCH) or with 1 µM of the NMDAR antagonist MK-801 (MK) followed by treatment with 100 nM of the A2AR agonist CGS-21680 (CGS), 15 µM NMDA or both, and the cAMP levels (C–E) and ERK 1/2 phosphorylation signal (F–H) were determined. The values are the mean ± SEM of 10 to 12 different experiments. The ERK 1/2 phosphorylation levels and cAMP increases were expressed as a percentage over basal. A one-way ANOVA followed by a Bonferroni multiple comparison post-hoc test showed a significant effect over 100% (* p < 0.05, ** p < 0.01, *** p < 0.001).

