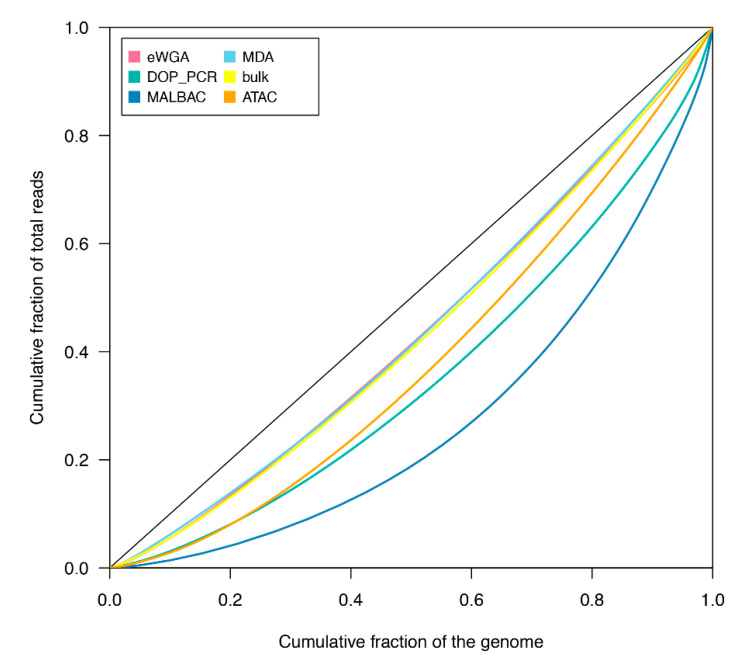
Figure 2.
Lorenz curves of coverage uniformity for reconstructed mtDNA genomes. The cumulative fraction of sequence reads against the cumulative fraction of genome covered is shown for each amplification protocol (eWGA, DOP-PCR, MALBAC and MDA) followed by WGS in HT-29 cells, the unamplified bulk of HT-29 and scATACseq data. The diagonal line represents the ideal perfect uniform coverage. The plot was generated using the Lc function in R package ineq.

