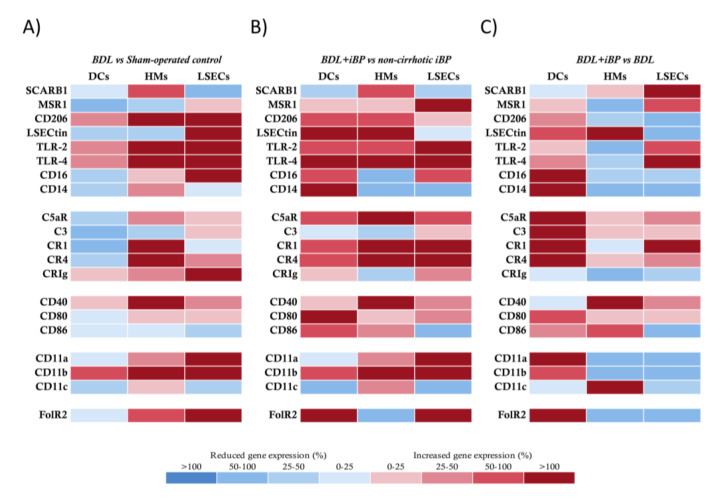
Figure 2.
Transcriptional profile comparison of innate receptors in APCs from bile duct ligation (BDL) animals. (A) BDL group vs. sham-operated control animals, (B) BDL+iBP animals vs. non-cirrhotic iBP group, and (C) BDL+iBP group vs. BDL group. Differential expression of up (red) and downregulated (blue) genes is scaled according to the color depicted. For each gene and each cell population, mean 2−ΔΔCt values were compared between animals in different study groups and represented as the percentage of variation between groups in paired comparisons.

