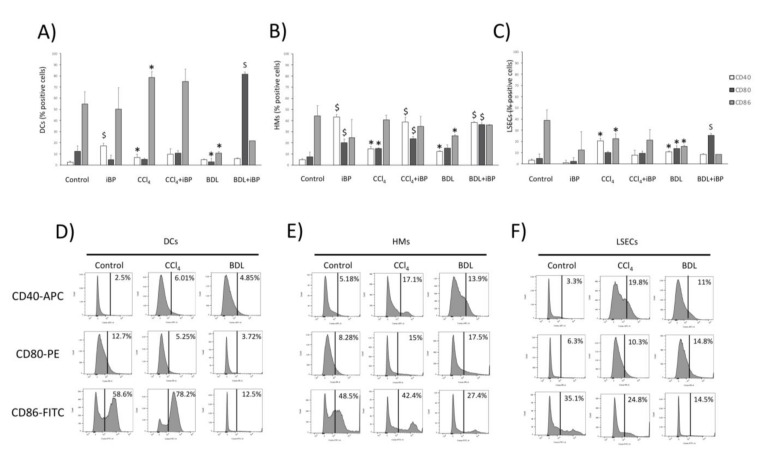
Figure 4.
Cell membrane expression of co-stimulatory molecules in hepatic APCs. Cell membrane expression of co-stimulatory molecules CD40, CD80, and CD86 evaluated by flow cytometry in DCs (A), HMs (B), and LSECs (C) from control (n = 6), CCl4 (n = 6), and BDL (n = 6) animals in different experimental conditions. (D–F) Representative histograms, showing the expression of co-stimulatory molecules in DCs (D), HMs (E), and LSECs (F) in control rats and the two experimental models of cirrhosis. * p < 0.01 compared to control rats; $ p < 0.01 compared with the same group without iBP.

