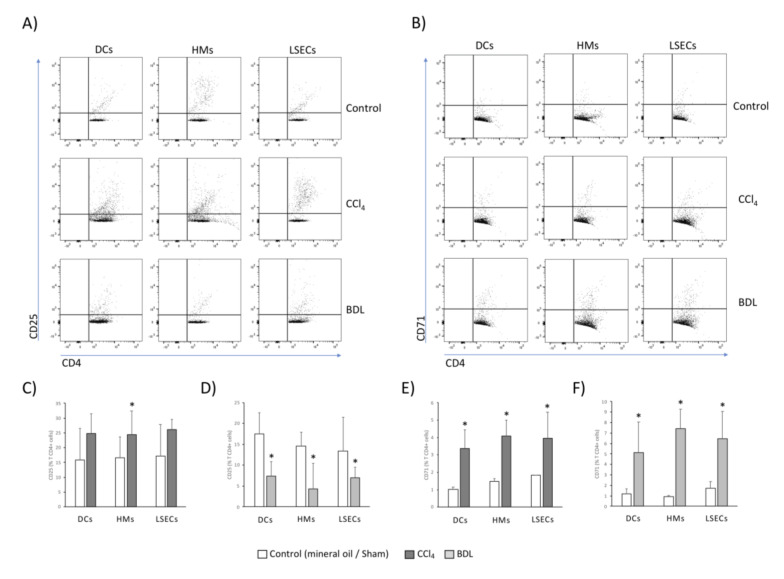
Figure 5.
Activation marker expression in spleen-derived T CD4+ cells after co-culture with hepatic APCs. Dot plot images for CD25 (A) and CD71 (B) in CCl4 and BDL models. Mean values ± standard deviation of percentage of T CD4+ cells expressing CD25 in CCl4 (C) and BDL models (D), and CD71 in CCl4 (E) and BDL models (F), are represented from at least 5 animals per group. * p < 0.01 compared with the same cell type in the control group.

