Figure 9.
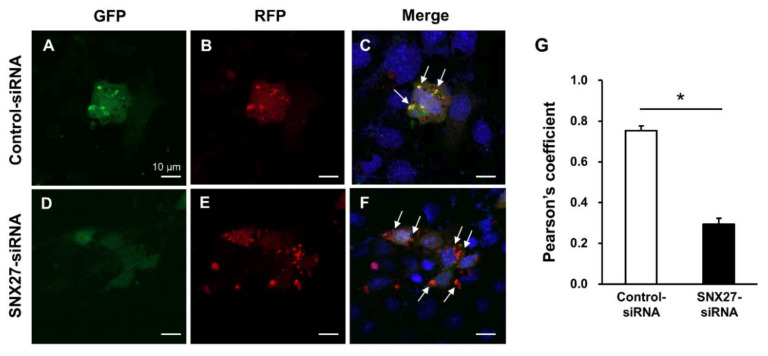
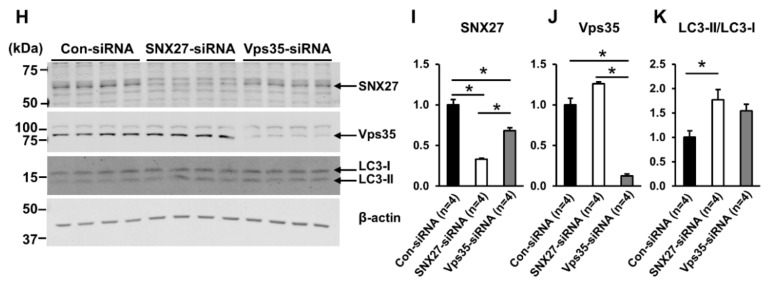
(A–F) Autophagic flux assessment using mRFP-GFP-LC3 in mpkCCDc14 cells transfected with control siRNA or SNX27-siRNA. To assess autophagic flux from the autophagosomes to lysosomes, RFP-GFP-LC3 plasmid was transfected into mpkCCDc14 cells. (A–C) GFP and RFP signals co-localize to yellow punctate structures in control siRNA-treated mpkCCDc14 cells (arrows). (D–F) GFP signal is quenched but RFP signal is seen in SNX27-siRNA-transfected mpkCCDc14 cells (arrows). (G) Co-localization of GFP and RFP signals was analyzed by calculation of the Pearson’s coefficient. Graphs express means ± SE (>20 cells per group; two independent experiments). (H-K) Semiquantitative immunoblotting of SNX27 (~65 kDa), Vps35 (~90 kDa), and LC3 (LC3-I: ~16 kDa and LC3-II: ~14 kDa) in total cell lysates from mpkCCDc14 cells transfected with control siRNA, SNX27-siRNA, or Vps35-siRNA. n indicates the number of cell preparations. * p < 0.05. Scale bars, 10 μm.


