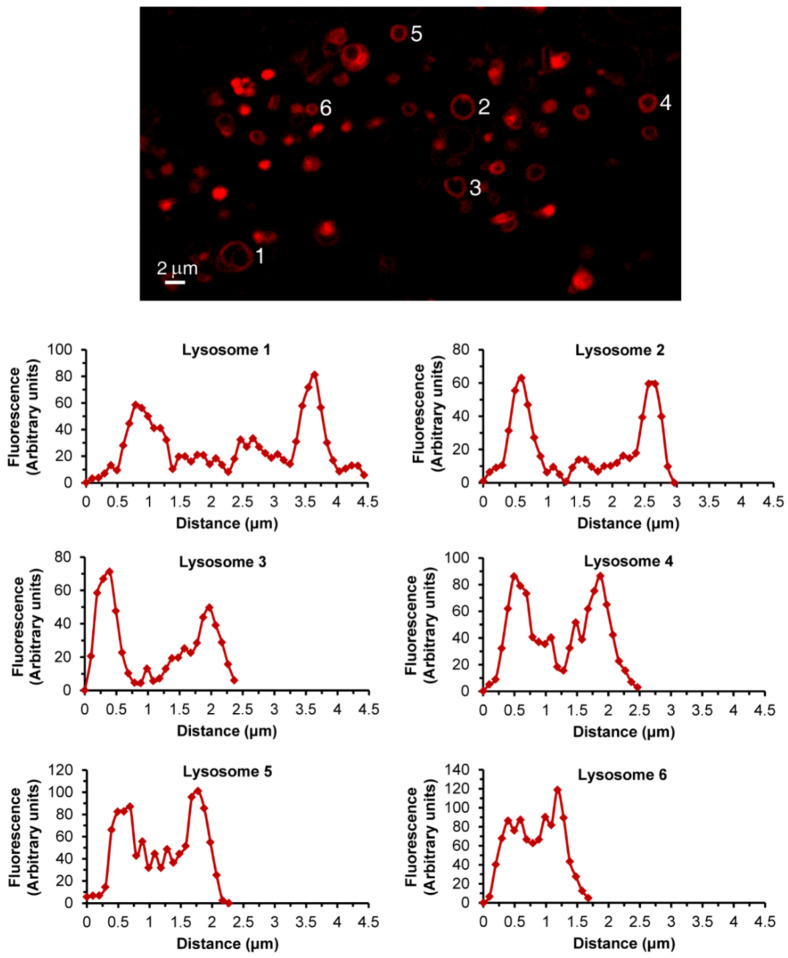
Figure 4.
Lysosomal DNR fluorescence analysis. Vacuolin-1-treated U2OS cells were loaded for 45 min with DNR and imaged with a confocal Zeiss LSM 710 microscope (×63 magnification). Individual lysosomes were analyzed for fluorescence intensity along their diameter using the ImageJ software. Each graph corresponds to a lysosome numbered in the photo.

