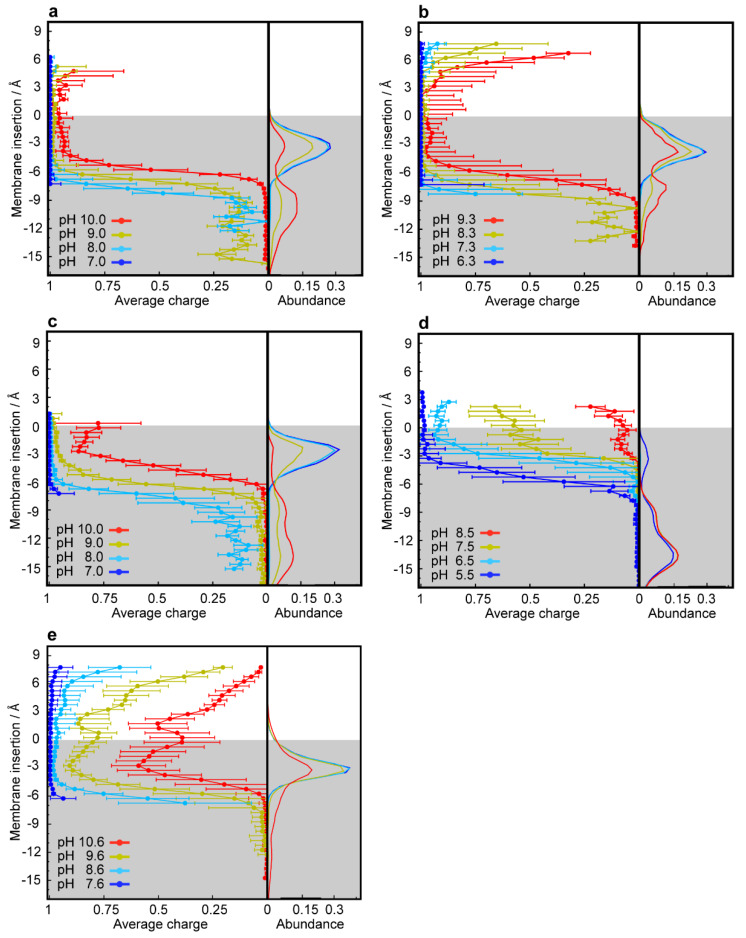
Figure 5.
CpHMD simulations of the membrane insertion of lysosomotropic compounds. Average protonation (left subplots) and abundance histograms (right subplots) are depicted along the membrane insertion axis for Ethop (a), Pimo (b), Clomp (c), NTD (d) and DNR (e). The gray-shaded areas represent the membrane internal regions below the phosphate groups, which are used as insertion references (see Materials and Methods).

