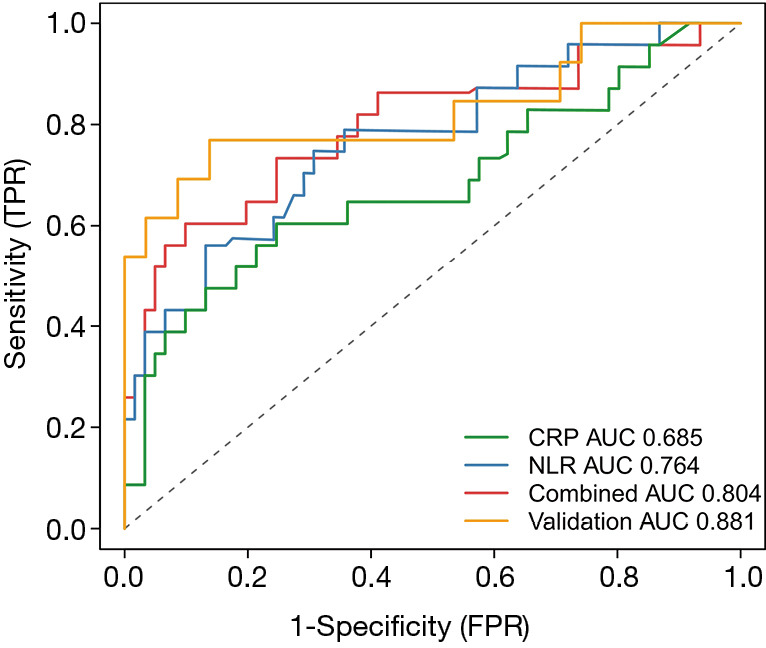
Figure 5.

ROC curve analysis using the NLR, CRP and Combined Index for predicting the 7-day endpoint. CRP yielded an AUC of 0.685 (95% CI: 0.574–0.783), while NLR yielded an AUC of 0.764 (95% CI: 0.659–0.850). The combined index in both training and validation sets yielded increased AUCs of 0.804 (95% CI: 0.702–0.883) and 0.881 (95% CI: 0.782–0.946), respectively. neutrophil-to-lymphocyte ratio; CRP, C-reactive protein; ROC, receiver operating characteristic; AUC, area under the curve.
