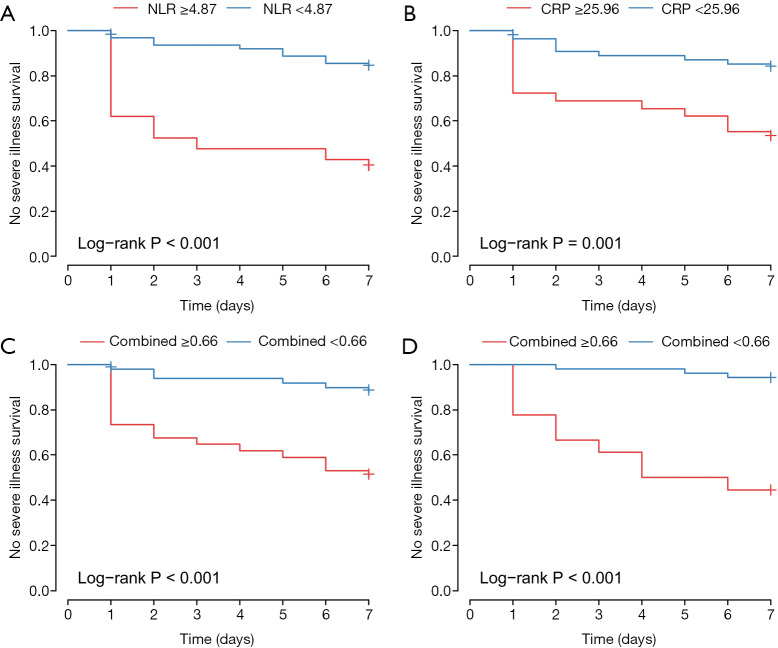
Figure 6.
Kaplan-Meier curves of survival in patients without severe illness according to binary risk group stratification by (A) NLR (low risk: <4.87; high risk: ≥4.87), (B) CRP (low risk: <25.96; high risk: ≥25.96), (C) Combined Index in the training set (low risk: <0.66; high risk: ≥0.66) and (D) Combined Index in the validation set (low risk: <0.66; high risk: ≥0.66). The mean survival time according to Kaplan-Meier curves is shown in Table S1. CRP, C-reactive protein; NLR, neutrophil-to-lymphocyte ratio.

