
. 2020 May;8(10):623. doi: 10.21037/atm-20-3192
2020 Annals of Translational Medicine. All rights reserved.
Open Access Statement: This is an Open Access article distributed in accordance with the Creative Commons Attribution-NonCommercial-NoDerivs 4.0 International License (CC BY-NC-ND 4.0), which permits the non-commercial replication and distribution of the article with the strict proviso that no changes or edits are made and the original work is properly cited (including links to both the formal publication through the relevant DOI and the license). See: https://creativecommons.org/licenses/by-nc-nd/4.0.
Figure 1.
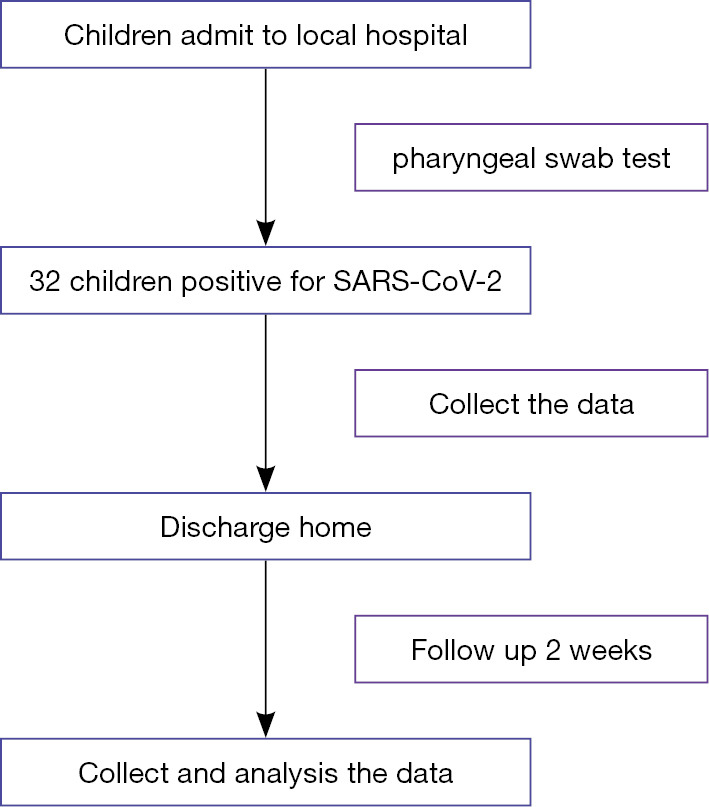
The flowchart of children enrolled in this study.