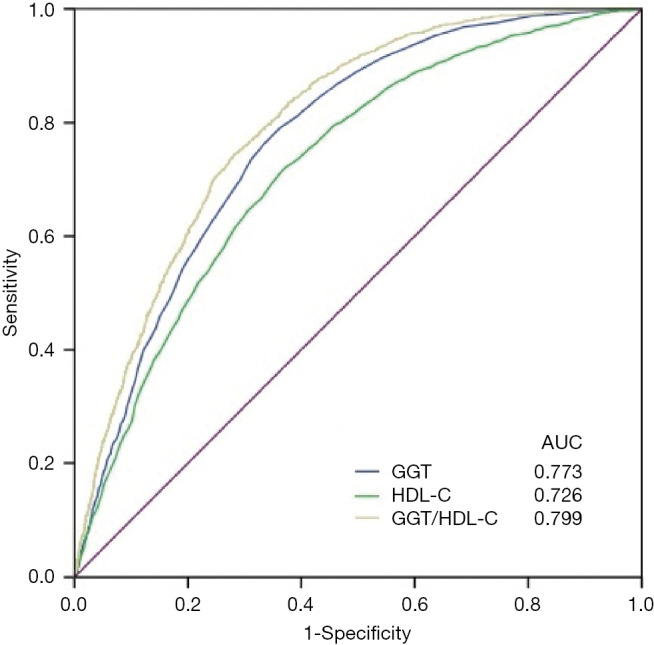
Figure 1.

ROC curves of GGT/HDL-C ratio for prevalence of NAFLD. ROC curves, receiver-operating characteristic curves; AUCs, areas under the ROC curves; GGT, γ-glutamyl transpeptidase; HDL-C, high-density lipoprotein cholesterol; GGT/HDL-C ratio, GGT/HDL-C ratio; NAFLD, nonalcoholic fatty liver disease.
