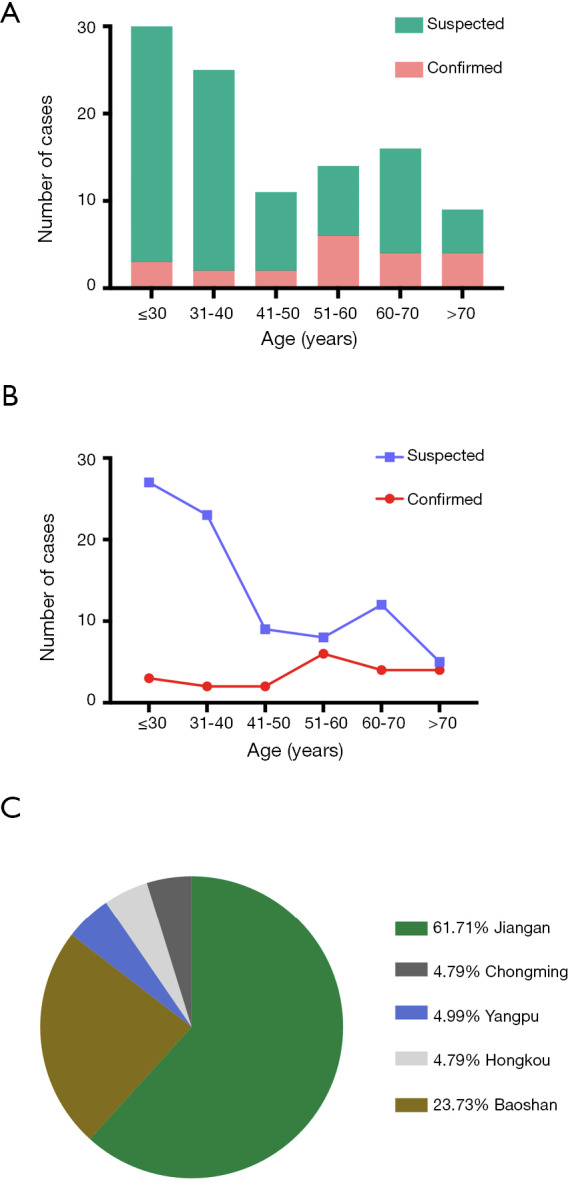
Figure 2.

Age and residence distributions of the present study. (A,B) Bar charts and line chart demonstrating the number of cases (y-axis) and age distribution (x-axis) of confirmed and suspected cases. (C) Pie charts demonstrating the etiology of residence based on retrospective diagnosis in the confirmed group.
