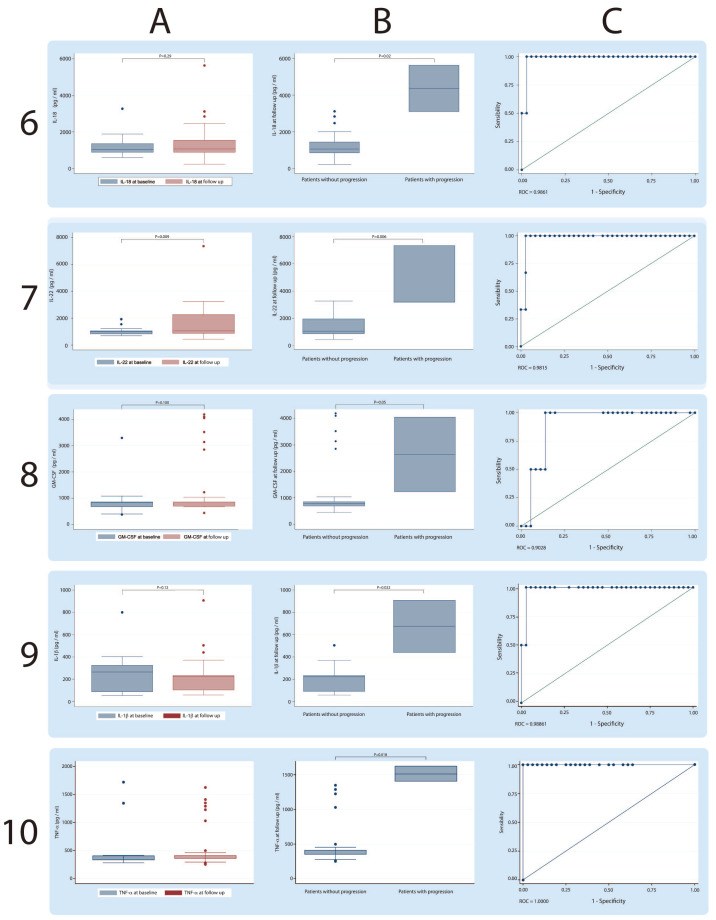
Figure 2.
Serum concentrations of cytokines IL-18, IL-22, GM-CSF and TNF-α in patients positive for ASSD autoantibodies. Each row shows a particular cytokine. Column A shows the global comparison at baseline and the follow-up; Column B shows the comparison made between patients with progression and patients without progression of ILD, and Column C shows the discrimination capacity of each cytokine calculated using ROC curves.

