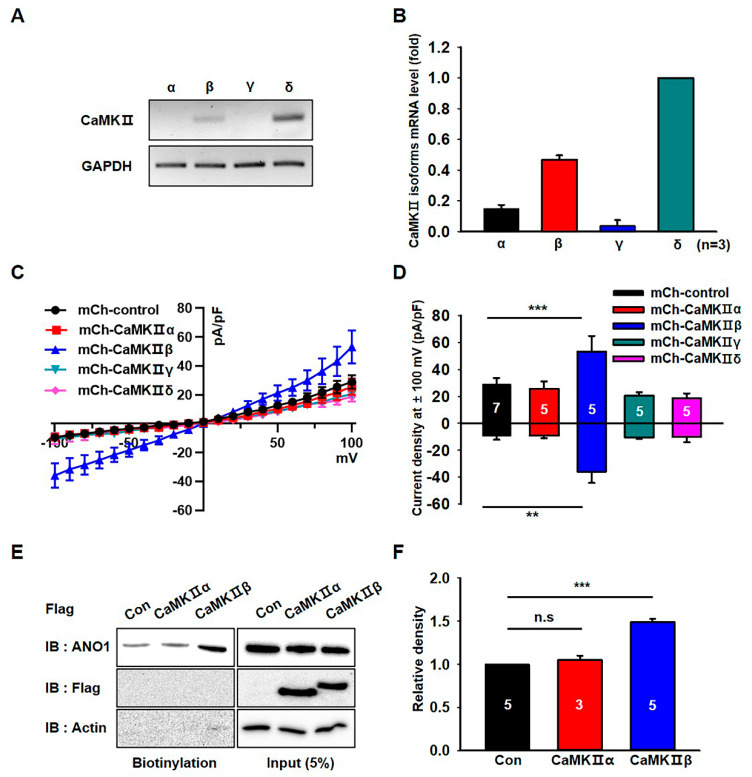
Figure 3.
CaMKIIβ specifically increases the surface expression and activity of ANO1 in U251 cells. (A) The mRNA expression of CaMKII isoforms in U251 cells were detected with specific primers for CaMKIIα, β, γ and δ. (B) Normalized expression of CaMKII isoforms as compared to that of GAPDH in U251 cells. (C) Effect of CaMKII isoform overexpression on ANO1-mediated whole cell chloride currents in U251 cells. (D) The summary bar graph showing ANO1-mediated current density at ± 100 mV. (E) Cell surface biotinylation results from membrane protein fractions from U251 cells transfected with mCh-CaMKIIα and mCh-CaMKIIβ. (F) The summary bar graph showing data obtained from at least three independent experiments as in (E). Number on each bar indicates n for each condition. All values are mean ± s.e.m. P-values were obtained with Student’s t-test. ** p < 0.01 and *** p < 0.001. n.s means not significant.

