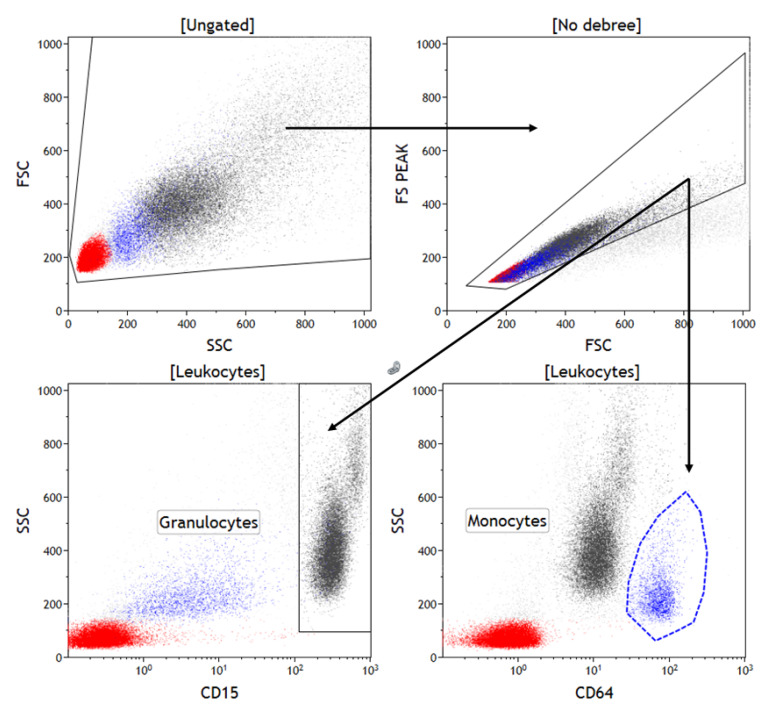
Figure 1.
Gating strategy for granulocytes and monocytes Legend. Gating strategy: Obtained events were gated in an FSC intensity and SSC intensity dot plot to eliminate debris. Cells were gated on an FSC intensity and FSC peak dot plot to eliminate doublets. Granulocytes were gated on an SSC vs. CD15 dot plot. Monocytes were gated on an SSC vs. CD64 dot plot. The expression level of selected markers is evaluated as fluorescence intensity on the histograms. FSC: Forward scatter, SSC: Side scatter.

