
Figure 2. Evaluation of the Prognostic Value of Each Hyperprogressive Disease (HDP) Index.
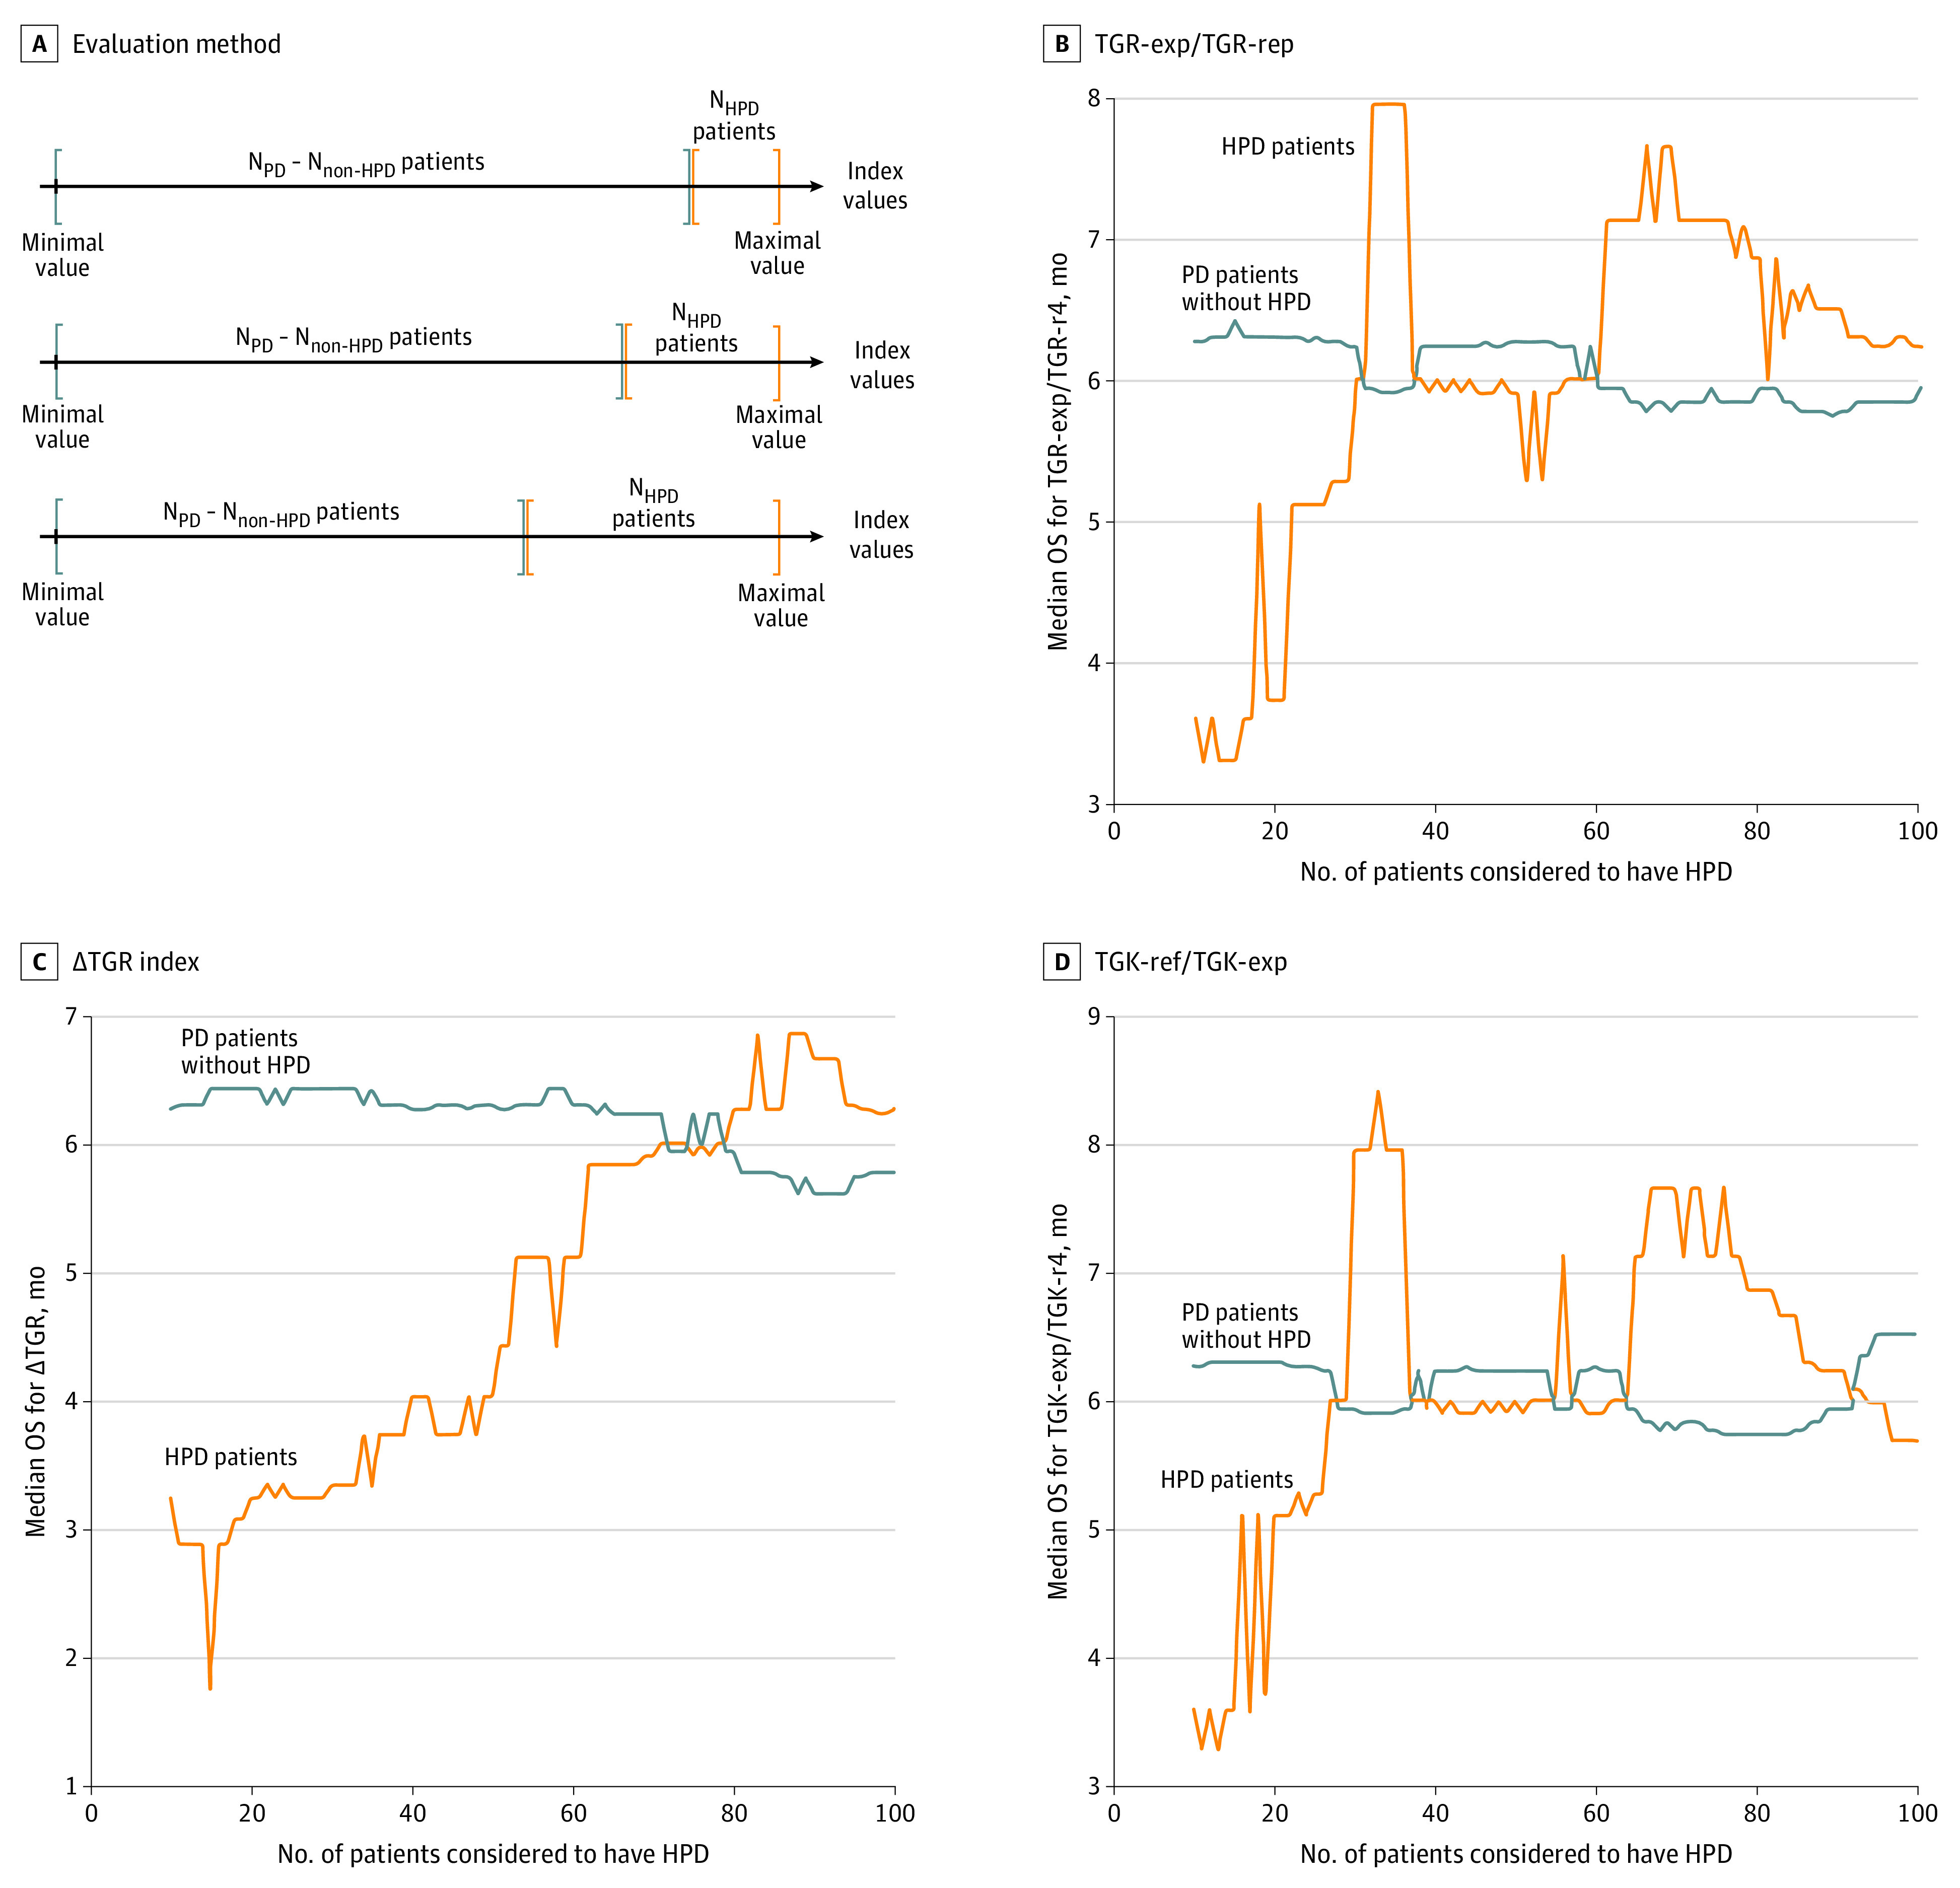
A, Evaluation method of the prognostic value of each index. For each index, patients were categorized into 2 groups according to their index value: those with the highest value (N) and those with progressive disease (NPD) minus N patients, to study the difference between the N with worst progression and the NPD – N other patients. We first set N = 10 and then increased its value until it reached half the number of patients with PD. This determines for which N the difference becomes negligible, which is the limit between patients with HPD and PD. A comparative landmark analysis was performed on these 2 groups for each value of N. B, Median overall survival (OS) curves for patients with HPD compared with PD without HPD according to the threshold ratio of tumor growth rate before (ref) and during (exp) therapy (TGR-exp:TGR-ref index) as a function of the number N of patients considered to have HPD. C, Median OS curves for HPD compared with PD without HPD according to the threshold TGR-exp − TGR-ref (ΔTGR) index as a function of the number N of patients considered to have HPD. D, Median OS curves for HPD compared with PD without HPD according to the threshold tumor growth kinetics before (ref) and during (exp) therapy (TGK-exp:TGK-ref) index as a function of the number N of patients considered to have HPD.