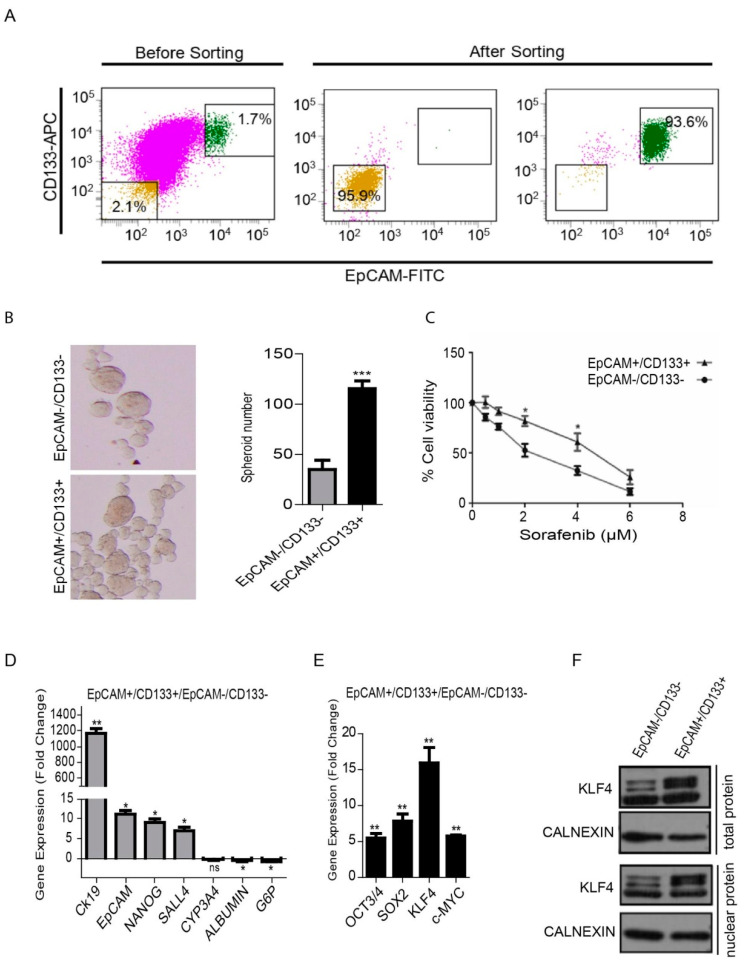
Figure 1.
Isolation and analysis of the EpCAM+/CD133+ liver cancer stem cell subpopulation from the HuH-7 cell line. (A) Analysis of the EpCAM and CD133 surface marker expressions in the HuH-7 cell line by flow cytometry. The HuH7 cell line was stained with EpCAM-FITC and CD133-APC antibodies, and was sorted using a BD FACS Aria III Cell Sorter. The sorted EpCAM+/CD133+ and EpCAM−/CD133− cells were stained after cell sorting to determine purity. (B) The spheroid formation ability of cells was tested in ultralow attachment plates. Representative images of the spheres formed are shown. Column graphs demonstrate the number of spheres calculated at the end of the experiment. (C) LCSCs and non-stem cells were treated with sorafenib (0 μM–8 μM) and the viability curve was calculated by a MTT test. (D) Stem/progenitor and hepatocyte marker gene expression and (E) the gene expression of the reprogramming factors in LCSCs and non-stem cells were analyzed using real-time PCR. Column graphs show the fold change normalized to RPL41, and calculated by using the 2−ΔΔCt method. (F) Western blotting analysis demonstrated a higher KLF4 expression in the whole lysate and nuclear protein extracts of EpCAM+/CD133+ LCSCs. Data represent the average of at least three independent experiments. * p < 0.05, ** p < 0.001, *** p < 0.0001. Error bars indicate standard deviation (SD).

