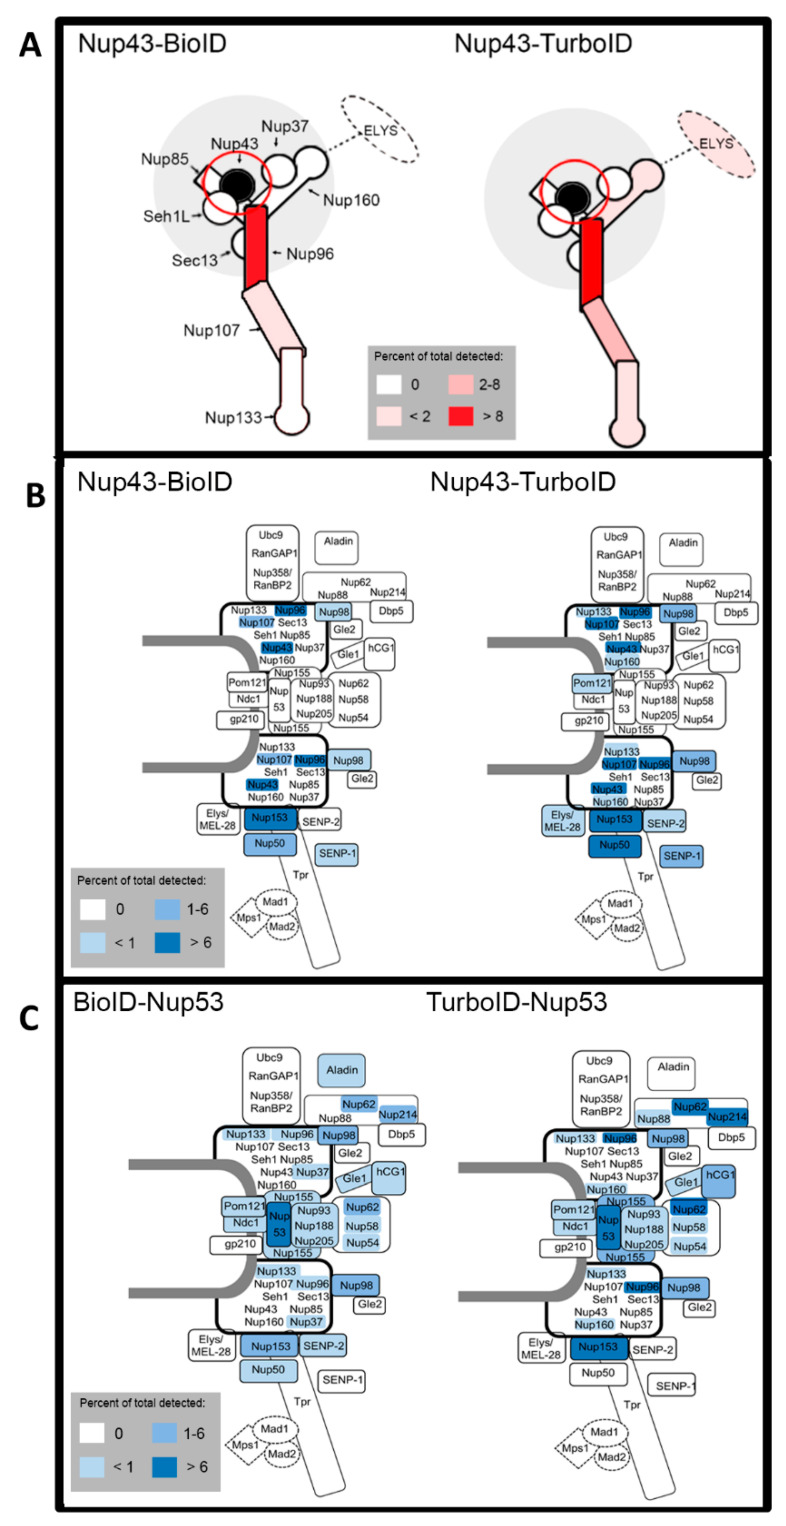
Figure 6.
Schematics of practical labeling radii comparisons for Nup43 and Nup53 fusion proteins. (A) Schematic of labeling radii of Nup43-BioID and Nup43-TurboID within the Nup107-160 complex. Intensity of red labeling correlates with normalized percent total detected for each identified protein. (B) Schematic of labeling radii of Nup43-BioID and Nup43-TurboID within the NPC. Intensity of blue labeling correlates with normalized percent total detected for each identified protein. (C) Similar schematic as (B) for BioID-Nup53 and TurboID-Nup53.

