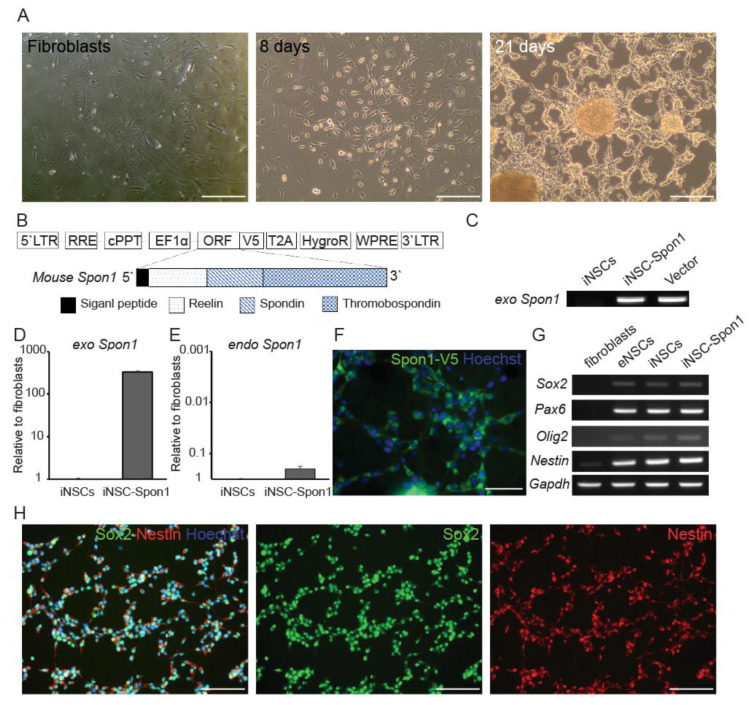
Figure 1.
Generation of induced neural stem cells harboring Spon1. (A) Cell morphology changed after mouse Octamer-binding transcription factor 4 (Oct4) infection. The left panel shows mouse fibroblasts used as parent cells before infection. The middle panel shows Oct4-infected cells 8 days after infection. The right panel shows NSC-like morphology 21 days after infection. Scale bar: 100 μm (B) Schematic drawing of lentiviral vector encoding full length of Spon1. A V5 tag was linked to the open reading frame (ORF). (C) Genotyping of integration of exogenous Spon1 (exo Spon1) in iNSC-Spon1. (D,E) The expression of the mouse Spon1 gene by qRT-PCR. Exogenous Spon1 (exo Spon1) in iNSC-Spon1 (D). Endogenous Spon1 (endo Spon1) gene expression was also quantified by qRT-PCR (E). Data are presented as mean ± SEM (n = 3). (F) Immunofluorescence images of ectopic expression of Spon1 in iNSC-Spon1. Anti-V5 antibody was used to detect V5-tagged Spon1. Scale bar: 50 μm (G) The expression of the NSC marker in engineered iNSCs using conventional PCR. Fibroblasts are parent cells of iNSCs and eNSCs are wild-type NSC. Gapdh is loading control. (H) Immunofluorescence images of NSC marker expression in iNSC-Spon1. Sox2 (Middle panel) and Nestin (Right panel) were co-stained and the nuclei were stained by Hoechst. The left panel is a merged image of Sox2, Nestin, and Hoechst. Scale bar: 100 μm.

