Figure 4.
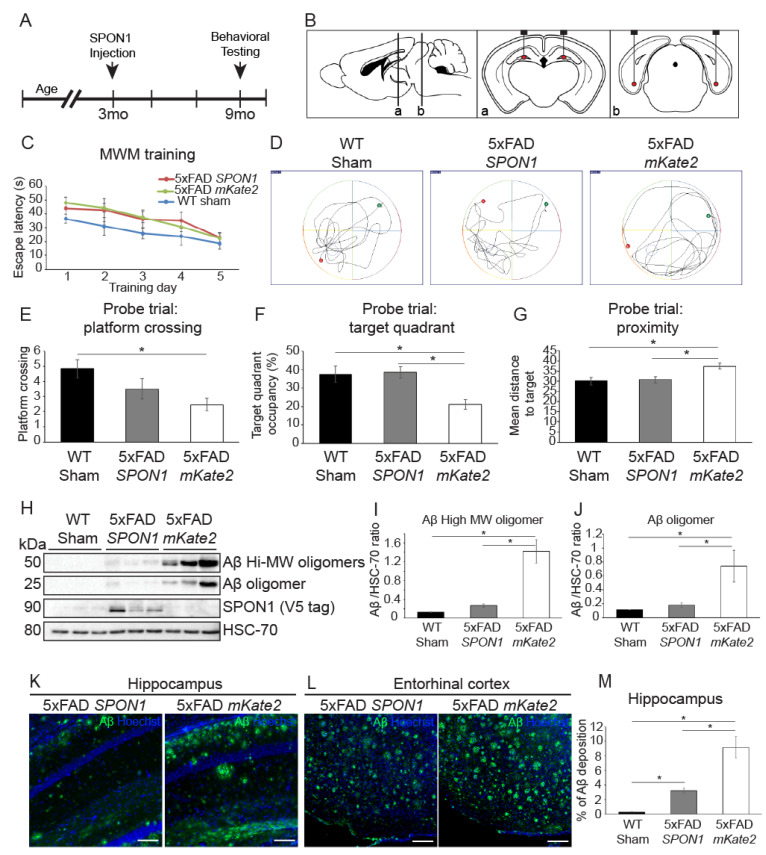
Alleviation of Spatial memory deficits in 5xFAD Alzheimer’s disease model mice by SPON1. (A) Schematic diagram of the experimental procedures. Intracranial injection of lentiviral vector encoding human SPON1 coding sequences on 3-month-old mice. When the mice were nine months old, the behavioral (Morris water maze; MWM) test was performed. All mice were sacrificed after the behavioral test. (B) Schematic illustration of the four SPON1 injection sites in the dentate gyrus of the hippocampus (a) and entorhinal cortex (b). (C) Escape latency in the MWM plotted against the training days. N number: WT sham 12, 5xFAD SPON1 14, 5xFAD mKate2 11. (D) Illustrative images of mouse trajectories during 1 min probe trial of the MWM test. The probe trial was performed without a platform 1 day after 5-day training. The platform was constantly located in the middle of the South/West during 5-day training. The green dot on the side of the North/East is the start site. The red dot is the last location of the mouse at the end of the 1-min probe trial. (E) Frequency of platform crossing during the 1-min probe trial of the MWM test. N number: WT sham 12, 5xFAD SPON1 14, 5xFAD mKate2 11. * indicates p < 0.05 (One-way ANOVA). (F) Percentage of time spent in the target quadrant during the 1-min probe trial of the MWM test. N number: WT sham 12, 5xFAD SPON1 14, 5xFAD mKate2 11. * indicates p < 0.05 (One-way ANOVA). (G) Mean distance to target during the 1-min probe trial of the MWM test. N number: WT sham 12, 5xFAD SPON1 14, 5xFAD mKate2 11. * indicates p < 0.05 (One-way ANOVA). (H–J) Aβ expression of 5xFAD by western blot. Western blot with the anti-Aβ (MOAB-2) antibody using the hippocampus from SPON1 or mKate2-injected 5xFAD (5xFAD SPON1 or 5xFAD mKate2 respectively). Aβ high molecular weight (~50 kDa) oligomers and Aβ (~25 kDa) oligomer were detected. The density of bands was quantified by imageJ (I,J). V5-tagged SPON1 was detected by anti-V5 antibody. HSC-70 is shown as a loading control. * indicates p < 0.05 (One-way ANOVA). (K,L) Representative images of the hippocampus (K) and entorhinal cortex (L) showing Aβ plaques. Scale bar: 100 μm (M) Quantification of Aβ plaques in the hippocampus. Percentage of green fluorescence with respect to the area of the picture. * indicates p < 0.05 (One-way ANOVA).

