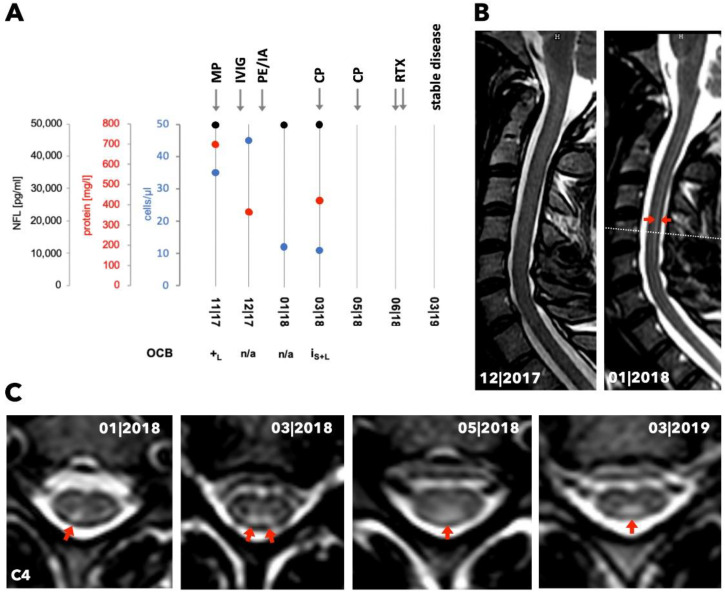
Figure 1.
Longitudinal laboratory and radiological data and treatment changes for patient 1. (A) Chart shows the course of cell count, concentrations of protein and neurofilament light chain (NFL) as well as the occurrence of oligoclonal bands (OCB) in the CSF over time (n/a = not examined, +L = detected in CSF, IS+L = identical OCB in serum and CSF). Arrows indicate time points of treatment (MP = methylprednisolone, IVIG = intravenous immunoglobulin, PE/IA = plasma exchange/immunoadsorption, CP = cyclophosphamide, RTX = rituximab). (B) Panel displays MRI (T2 sagittal plane) at two different time points. The red arrows indicate the T2-enhancement of the posterior part of the spinal cord. The dotted line presents the height of the transversal planes shown in (C). (C) Transversal planes of the cervical spinal cord (C4) show T2-enhancement over time in the posterior columns, indicated by the red arrows.

