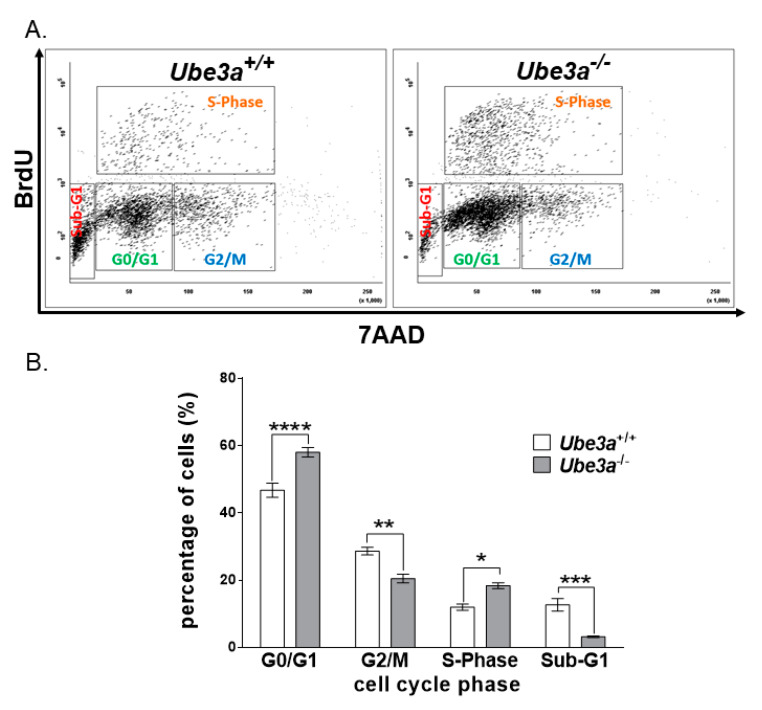
Figure 2.
Ube3a deletion alters cell cycle progression. (A) Representative dual-parameter flow cytometry scatter plot showing the cell cycle progression of BrdU versus 7AAD, following 1-h incubation with BrdU in Ube3a+/+ and Ube3a−/− MEFs. (B) Graph showing the respective percentages of cells at each cell-cycle stage (n = 3 independent experiments). The data are presented as the means ± SEM (* p < 0.05, ** p < 0.01, *** p < 0.001, and **** p < 0.0001).

