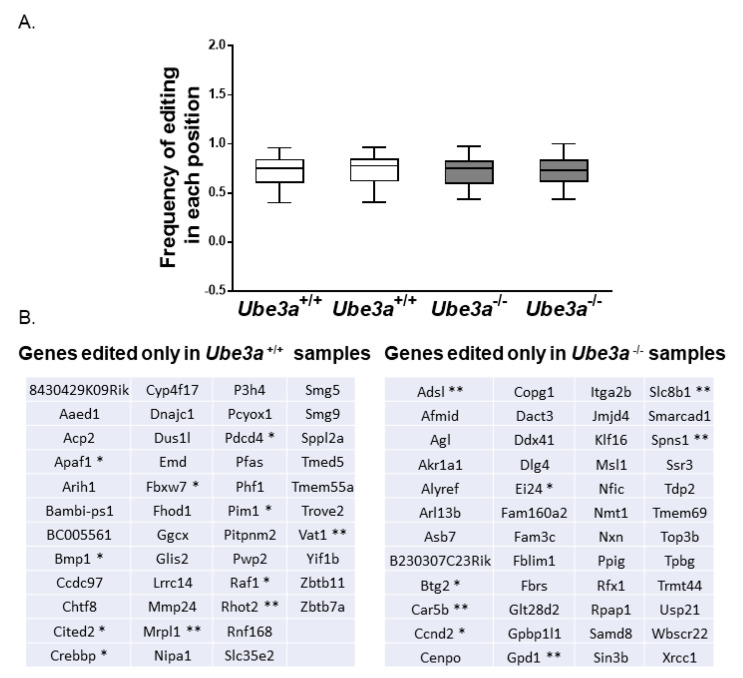
Figure 5.
Differential RNA editing as determined by the GIREMI algorithm. (A) Box plot of RNA editing representing the frequencies of editing across the genome in each sample. The average frequency of RNA editing is not changed in Ube3a−/− compared to Ube3a+/+ MEFs. (B) Genes uniquely edited in Ube3a+/+ and Ube3a−/− MEFs (* signifies apoptosis-associated genes, and ** signifies mitochondria-related genes).

