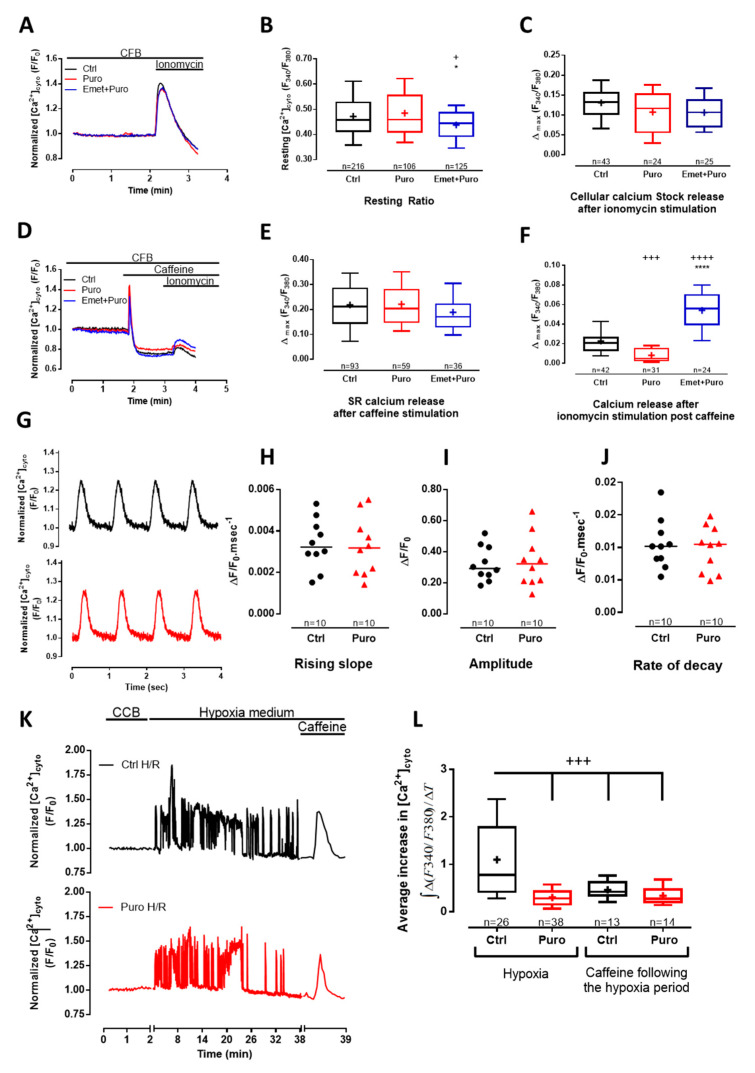
Figure 2.
The reticular puromycin-mediated Ca2+ stock release was independent of the one stimulated by caffeine and did not affect excitation–contraction (E-C) coupling. (A,D) Time traces showing cytosolic Ca2+ concentration assessed by fura2-AM (acetoxymethyl ester) cytosolic probe, in Ctrl condition and after 30 min of 200 µM puromycin pretreatment or 20 µM emetine +200µM puromycin pretreatment. Effect of puromycin and emetine + puromycin was measured after cardiomyocyte (CM) pretreatment in Ca2+-containing buffer (CCB) for 30 min (see the Materials and Methods section). Ca2+ content was figured out by the maximum amplitude of fura2-AM fluorescence ratio (∆max Ratio(340/380)) after the addition of different stimulations in a Ca2+-free buffer (CFB). (B) Box blots representing the steady-state cytosolic Ca2+ concentration and (C) total cell Ca2+ content assessed by 5 µM of ionomycin stimulation. (E) RyR2-dependent Ca2+ stores assessed by 10 mM of caffeine stimulation and (F) remaining cell Ca2+ content after caffeine stimulation assessed by ionomycin stimulation. (G–J) Cytoplasmic Ca2+ transients were recorded using fluo5-AM–loaded intact CM electrically stimulated at 1 Hz. (G) Representative cytoplasmic Ca2+ transients in the absence or after 30 min of puromycin pretreatment; ΔF/F0 = normalized change fluorescence. (H) Scatter blots representing cytoplasmic Ca2+ transients amplitude, (I) Ca2+ transients rising slope (calculated from the relative amplitude and time to peak of the electrical induced Ca2+ transient), and (J) Ca2+ transients rate of decay. (K) Time traces displaying cytosolic Ca2+ concentration (measured by the fura2-AM fluorescence ratio) in a Ctrl CM and in a 200 µM puromycin preconditioned CM subjected to a 30 min ischemia-like hypoxia. At the end of the 30 min, 10 mM caffeine was added to the medium. CCB means Ca2+-containing buffer. (L) Average increase in the cytosolic Ca2+ concentration [Ca2+]cyto was figured out as masses of fura2-AM fluorescence signal over time in CM treated as explained in (K). Data are from at least three independent experiments. n = cell count. Statistics: + p < 0.05, +++ p < 0.001, ++++ p < 0.0001 vs. Ctrl, * p < 0.05, **** p < 0.0001 vs. Puro (puromycin).

