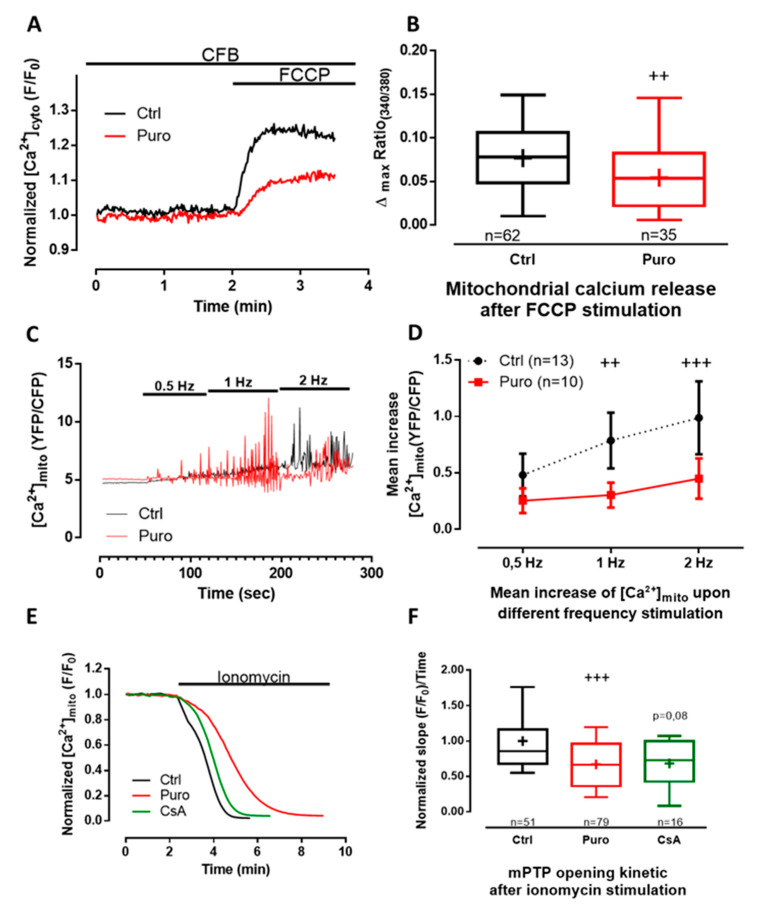
Figure 3.
Puromycin pretreatment modified mitochondrial Ca2+ content in beating CM and delays mitochondrial permeability transition pore (mPTP) opening. (A) Representative time traces of mitochondrial Ca2+ concentration (expressed as the 340/380 fluorescent ratio of fura2-AM cytosolic probe)) from Ctrl and CM pretreated with 200 µM of puromycin for 30 min. (B) Boxplots represent mitochondrial calcium content assessed by 25 µM of FCCP (Carbonyl cyanide 4-(trifluoromethoxy)phenylhydrazone) stimulation (expressed by the delta max of the 340/380 fluorescent ratio of fura2-AM cytosolic probe) in Ctrl condition and after 30 min of 200 µM puromycin pretreatment. (C,D) Mitochondrial Ca2+ rises recorded in 4mtD3cpv-positive CM electrically stimulated successively at 0.5, 1, and 2 Hz. (C) Representative time traces of mitochondrial Ca2+ concentration in Ctrl and after 30 min of puromycin pretreatment, expressed as YFP/CFP fluorescent ratio with a time binning of 4 (every 2.12 sec). (D) Corresponding averaged mean increase of mitochondrial Ca2+ concentrations at the same range of stimulation frequencies. (E) Representative time traces of calcein fluorescence from Ctrl, and 1 µM cyclosporin A (CsA)-pretreated and puromycin-pretreated CM. (F) Boxplots representing the slope of the mitochondrial calcein fluorescence decay induced by ionomycin stimulation. Data are represented as medians (except in E, mean ± SEM) from at least three independent experiments. n = cell count. Statistics: ++ p < 0.01, +++ p < 0.001 vs. Ctrl.

