Figure 4.
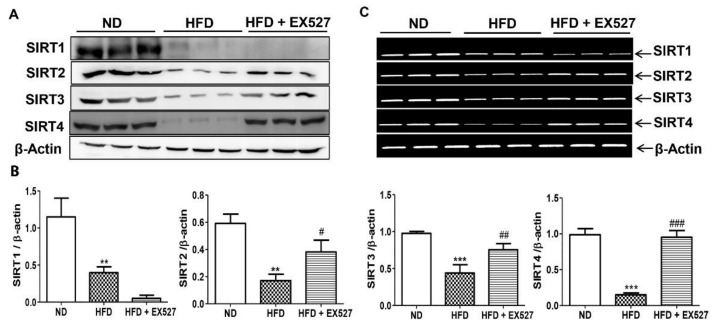
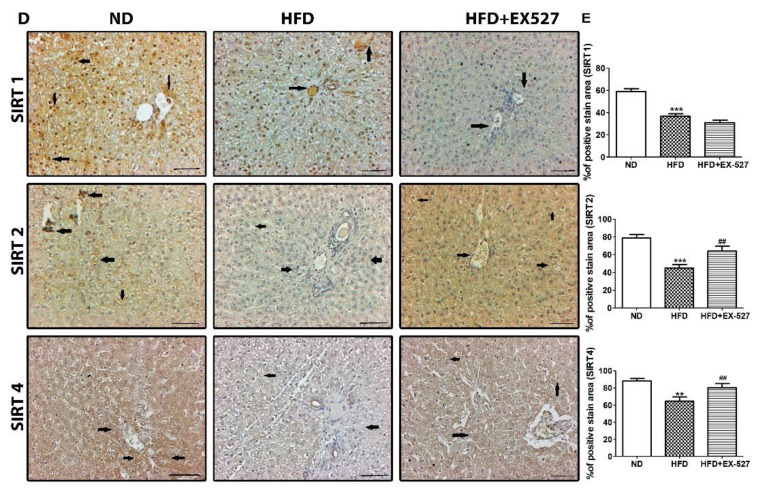
Effect of EX-527 on SIRT expression in the liver of HFD-induced diabetic rats was studied by Western blot, polymerase chain reaction (PCR) and immunohistochemistry. Male ZDF rats were fed either control diet or a high-fat diet (HFD) for 11 weeks. (A) Representative Immunoblotting bands of SIRT1, SIRT2, SIRT3 and SIRT4, were shown using an experimental model of HFD-induced diabetic rats. β-Actin expression was used as the loading control. (B) The intensity of the bands was analyzed densitometrically by ImageJ software. (C) mRNA expression levels of SIRTs (SIRT1, SIRT2, SIRT3 and SIRT4) was analyzed by PCR. (D) Representative Immunohistochemical staining of SIRT1 SIRT2 and SIRT4 were shown for in the liver tissue of HFD-induced diabetic rats. Black arrows represent expression rate. Original magnification: 200×, scale bar: 100 μm. ND, normal diet; HFD, high-fat diet. (E) Representative the percentage (%) of positive area staining of SIRT1 SIRT2 and SIRT4. The values are mean ± S.D. of six rats per group (n = 6). Statistical analysis was performed using one-way analysis of variance (ANOVA) followed by Tukey’s honestly significant difference (HSD) post-hoc test for multiple comparisons. ** p < 0.01, and *** p < 0.001 compared with the normal diet group (ND); # p < 0.05, ## p < 0.01, and ### p < 0.001 compared with the HFD group. ND, normal diet; HFD, high-fat diet.


