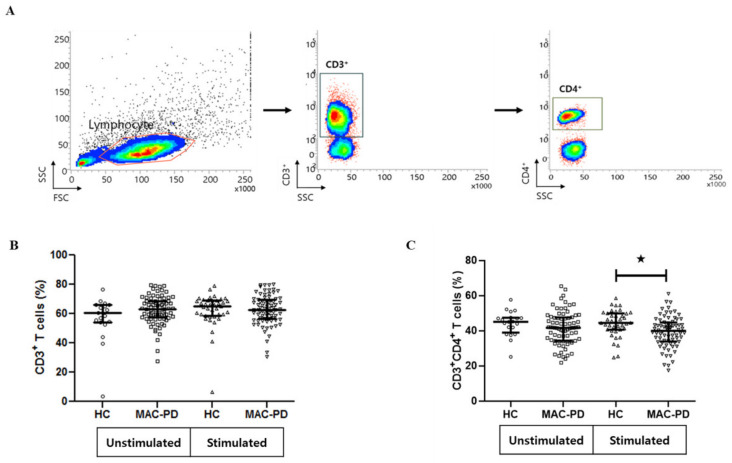
Figure 1.
Frequency of CD3+ and CD3+CD4+ T cells in peripheral blood mononuclear cells (PBMCs) from MAC-PD. The proportion of CD3+ and CD3+CD4+ T cells in MAC-stimulated cultures. MAC-PD (n =71), and HC (n = 20). (A) The gating strategy for flow cytometric analysis; (B) comparison of proportion of CD3+ T cells between MAC-PD patients and control individuals (unstimulated and stimulated); (C) comparison of proportion of CD3+CD4+ T cells between MAC-PD patients and control individuals (unstimulated and stimulated). Each symbol represents one single individual. Horizontal bars denote mean levels in each group. Statistical comparisons were performed using a Student’ t test. ★indicate statistical significance (p < 0.05). MAC-PD, Mycobacterium avium complex pulmonary disease; MAC, Mycobacterium avium complex; HC, Healthy controls.

