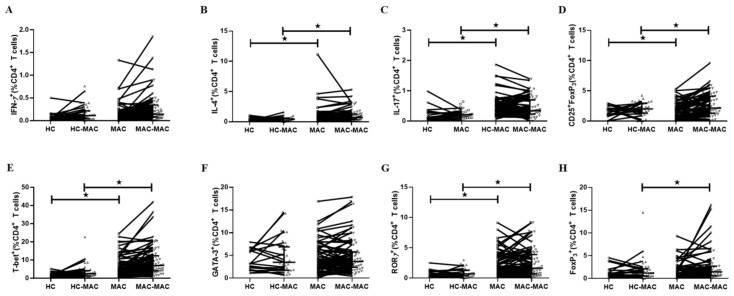
Figure 2.
T cell cytokine profiles in MAC-PD patients. Representative flow cytometry plots of the expression of (A) IFN-γ, (B) IL-4, (C) IL-17, (D) CD25+Foxp3+ T cells, (E) T-bet, (F) GATA3, (G) RORγ, and (H) Foxp3 after simulation with MAC bacilli in one individual from each group. The frequency of each cytokine-producing cells expressed as a percentage of the total CD3+CD4+ T cell population is indicated. Bar represents the median. Symbols shown below the horizontal dashed line correspond to non-responders. Statistical comparisons were performed using a Mann–Whitney test. ★indicate statistical significance (p < 0.05). MAC-PD, Mycobacterium avium complex pulmonary disease; MAC, Mycobacterium avium complex; HC, Healthy controls; HC-MAC, MAC-stimulated in healthy controls; MAC-MAC, MAC-stimulated in MAC-PD

