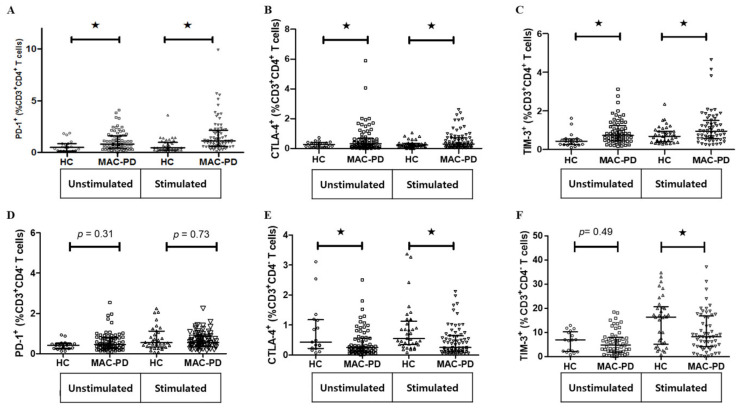
Figure 4.
Expression of PD-1, CTLA-4, and TIM-3 after ex vivo stimulation of PBMCs. Data are shown as scatter plots of the percentage of (A–C) the CD3+CD4+ T cell and (D–F) the CD3+CD4- T cell population expressing PD-1, CTLA-4, and TIM-3 with median for MAC-PD compared with HC. Statistical comparisons were performed using a Mann–Whitney test. ★indicate statistical significance (p < 0.05). MAC-PD, Mycobacterium avium complex pulmonary disease; MAC, Mycobacterium avium complex; HC, Healthy controls.

