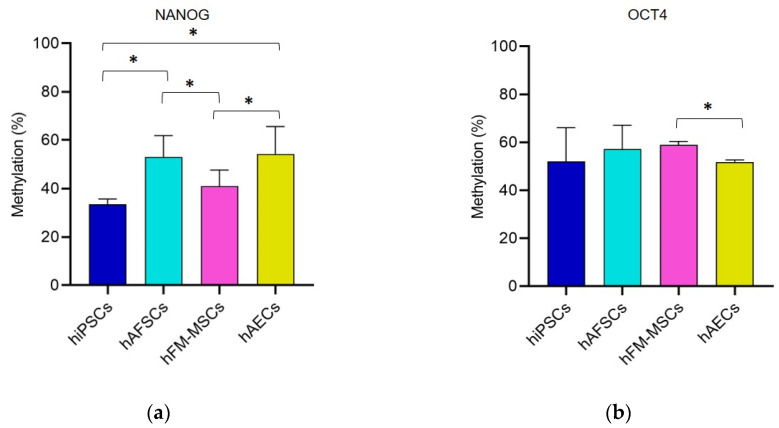
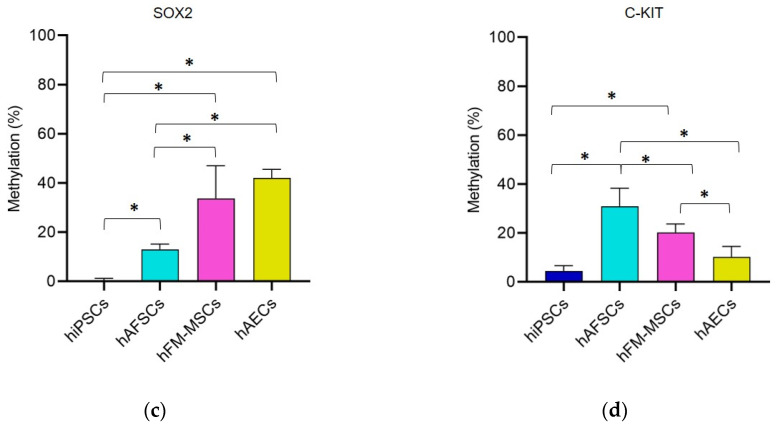
Figure 1.
The methylation profile of NANOG, OCT4, SOX2, and C-KIT in hiPSCs and perinatal stem cells (SCs). Pyrosequencing results showed the percentage of methylation levels in the promoter region of (a) NANOG, (b) OCT4, (c) SOX2, and (d) C-KIT in SCs from different sources. The graphs show the mean ± SD of 5 independent experiments, * p < 0.05.


